
Part 12 · Module 4
Intraclass Correlation Coefficient
Learn how to choose, calculate and report the correct intraclass correlation coefficient for continuous ratings or repeated measurements.
Learning outcomes
After completing this lecture, you should be able to:
- Explain ICC as a variance-ratio reliability measure.
- Distinguish one-way, two-way random and two-way mixed models.
- Distinguish consistency from absolute agreement.
- Distinguish single-measure from average-measure ICC.
- Calculate and interpret variance components and ICC estimates.
- Use R code to report a fully specified ICC.
Overview
The intraclass correlation coefficient, ICC, measures the reliability of numerical ratings or measurements.
It compares between-target variation with measurement-error and rater variation.
There are several ICCs because designs differ in:
- whether every target has the same raters;
- whether raters are fixed or sampled;
- whether systematic rater differences count as disagreement;
- whether one rating or an average will be used.
Shrout and Fleiss described six classical forms [1]. McGraw and Wong later clarified model, type and definition terminology [2].
Reporting simply “ICC = 0.90” is incomplete.
Why this matters
The same data can produce:
- a high consistency ICC;
- a lower absolute-agreement ICC;
- a higher average-measure ICC than single-measure ICC.
Each value answers a different question.
In the simulated study, three raters preserve participant ranking very well, but their average levels differ by several units.
Consistency is therefore higher than absolute agreement.
When to use ICC
Use ICC for numerical measurements when:
- repeated ratings belong to the same targets;
- a variance-component model is appropriate;
- the reliability target is defined;
- participant range represents intended use.
Use Bland–Altman analysis when the main question concerns absolute differences between two methods.
Use kappa for categorical ratings.
Research question and variables
The example asks:
If one of three similarly trained raters measures a participant, how reliable is one absolute score?
This corresponds to a two-way random-effects, absolute-agreement, single-measure ICC, often denoted ICC(2,1) or ICC(A,1).
A second question is:
How reliable is the average of all three raters?
That requires the average-measure ICC.
Data structure
Three-rater numerical data
simulated data| Variable | Meaning |
|---|---|
id | Target or participant |
rater_1 | Numerical measurement |
rater_2 | Numerical measurement |
rater_3 | Numerical measurement |
Every participant is rated by the same three raters.
Statistical assumptions
Choosing the correct ICC
ICC is not one statistic. Choosing an ICC requires decisions about the rater design, what counts as disagreement, and whether one measurement or an average will be used.
ICC study-design and selection flowchart
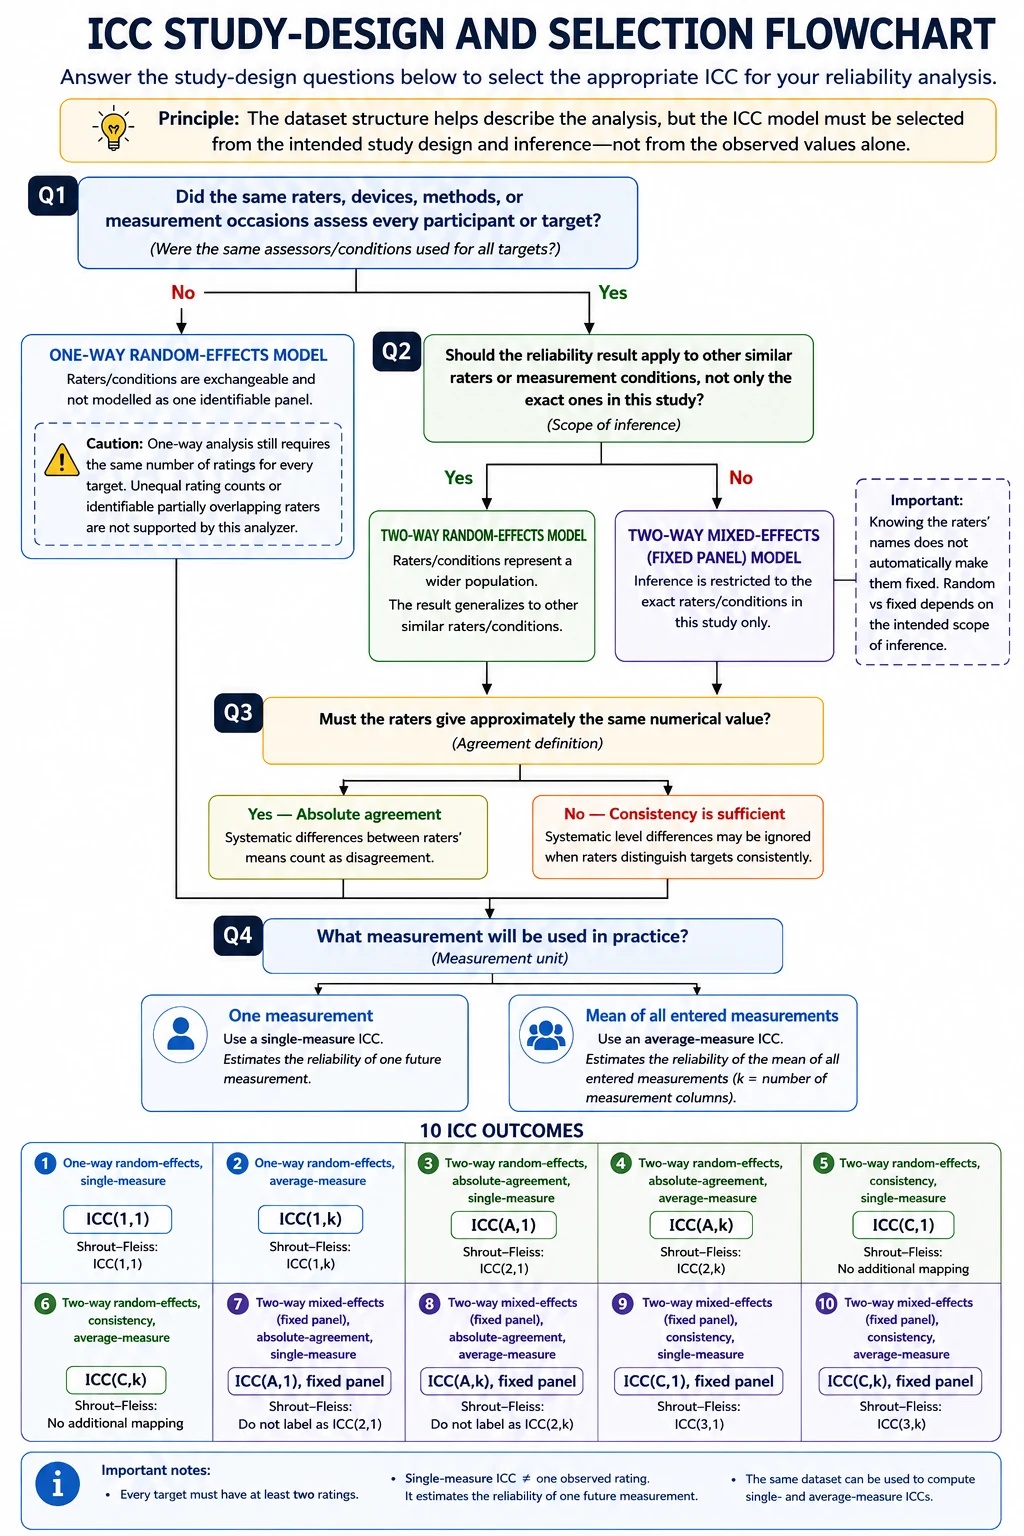
Open the full-resolution flowchart (PNG).
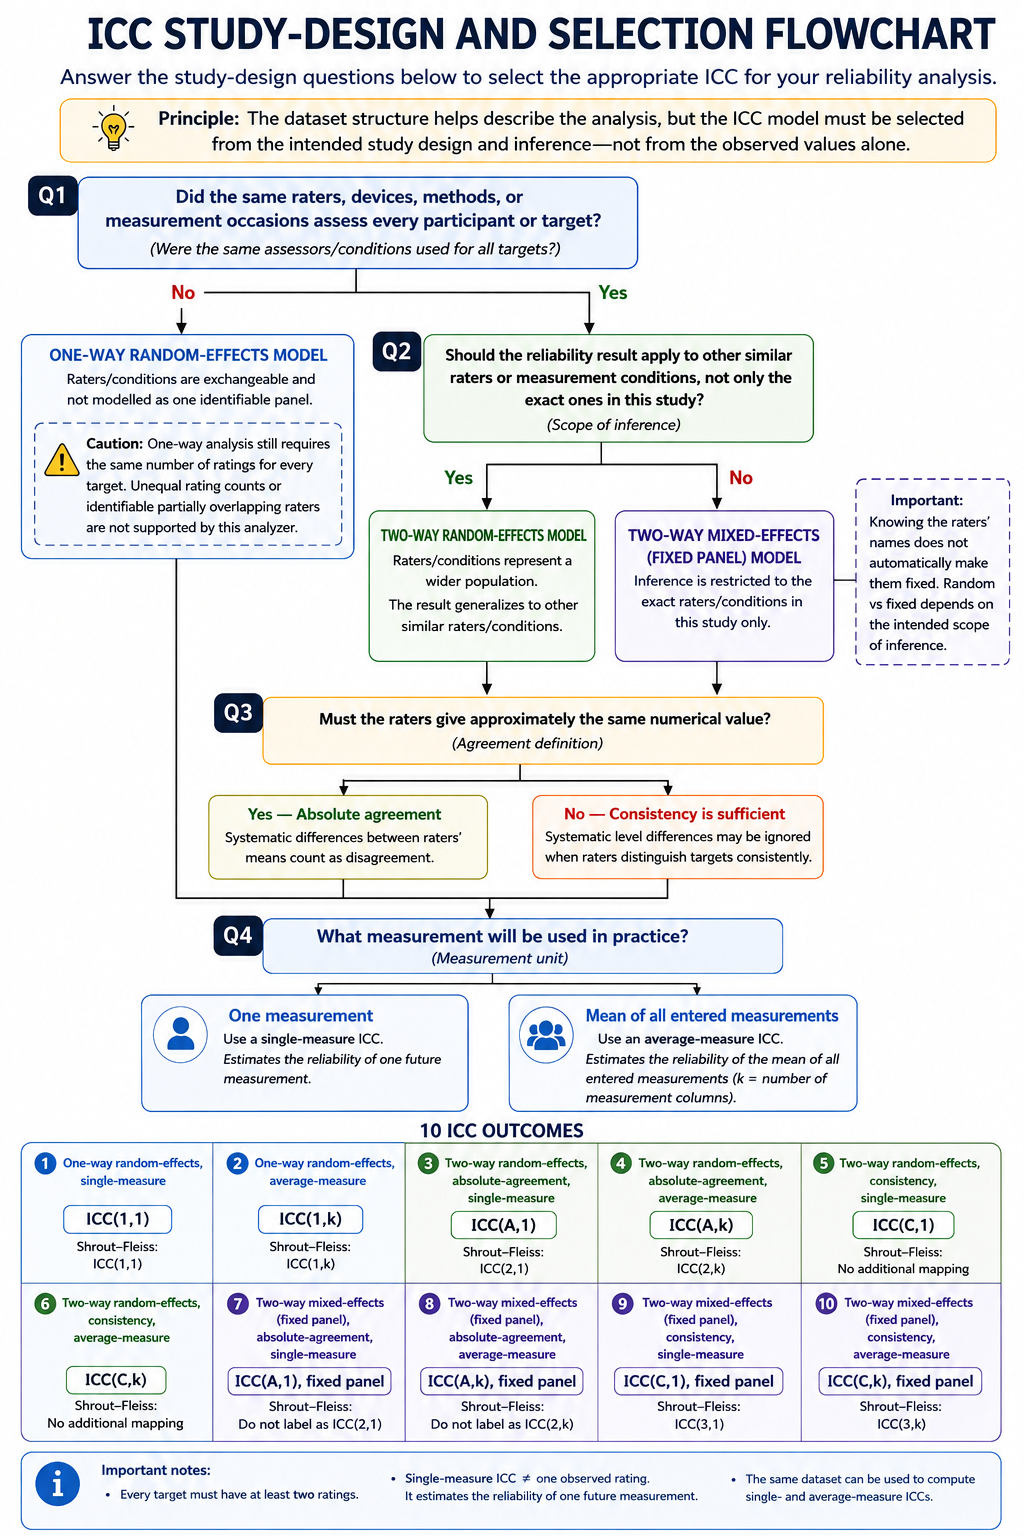
Decision 1 — Did the same raters assess every target?
When different or rotating assessors may rate different participants, a one-way random-effects model can be appropriate. The assessors are treated as exchangeable, and a separate systematic assessor effect is not estimated. For example, whichever available triage nurse is on duty may assess each participant.
When the same identifiable panel assesses every target, use a two-way model. For example, the same three radiologists might independently assess every scan.
The one-way analysis implemented by the calculator still requires the same number of ratings for every target. The rating positions are treated as exchangeable. Unequal numbers of ratings, identifiable partially overlapping raters and other unbalanced designs require a more general model.
Decision 2 — Should inference extend beyond these raters?
With the same panel for every target:
- use a two-way random-effects model when the raters or measurement conditions are regarded as a sample from a wider population of comparable raters;
- use a two-way mixed-effects or fixed-panel model when the conclusion is restricted to the exact raters, devices, methods or occasions studied.
Random versus fixed concerns the intended inference, not merely whether the raters have names.
Decision 3 — Absolute agreement or consistency?
Consider these ratings:
| Participant | Rater A | Rater B |
|---|---|---|
| 1 | 10 | 15 |
| 2 | 20 | 25 |
| 3 | 30 | 35 |
| 4 | 40 | 45 |
| 5 | 50 | 55 |
Rater B is always 5 units higher. The raters preserve participant ordering exactly, so consistency can be very high. Absolute agreement is lower because the reported numerical values are not the same.
- Absolute agreement: systematic rater mean differences count as disagreement.
- Consistency: systematic differences in level are not counted as disagreement when raters distinguish and rank targets consistently.
When measurements are expected to be interchangeable in their numerical values, absolute agreement is usually more relevant than consistency. This is not a universal rule; the definition must follow the intended use.
Decision 4 — One measurement or an average?
A single-measure ICC describes the reliability of one rating or measurement.
An average-measure ICC describes the reliability of the mean of ratings. When single-measure reliability is positive and the model is appropriate, averaging commonly improves reliability by reducing random error. Do not report an average-measure ICC when the clinical or research workflow uses one rating.
The value of must match the number of measurements that will actually be averaged. The current calculator uses all entered measurement columns and does not extrapolate to a different hypothetical .
Decision table
| Study design | Appropriate ICC |
|---|---|
| Different or random raters may assess different targets; one rating is used | One-way random, single — ICC(1,1) |
| Different or random raters; the final result is the mean of ratings | One-way random, average — ICC(1,k) |
| Same raters assess everyone; generalise to similar raters; exact values matter | Two-way random, absolute, single — ICC(A,1) / ICC(2,1) |
| Same raters; generalise; consistency is sufficient | Two-way random, consistency, single — ICC(C,1) |
| Same fixed raters only; exact numerical agreement matters | Two-way mixed, absolute, single — ICC(A,1), fixed panel |
| Same fixed raters; consistency is sufficient | Two-way mixed, consistency, single — ICC(C,1) / ICC(3,1) |
| The final result is an average | Use the corresponding average-measure form ICC(…,k) |
Where no direct Shrout–Fleiss notation exists, do not invent one. McGraw–Wong notation distinguishes design forms that can share the same numerical formula but support different inference.
Try the calculator: Intraclass Correlation Reliability Analyzer
How the method works
For a two-way design:
- is the target mean square;
- is the rater mean square;
- is residual mean square;
- targets;
- raters.
Worked example
Worked analysis in R
Download the lecture dataset using the Dataset link on this page and save it in the R working directory before running the code.
measurement_data <- read.csv(
  "part-12-continuous-measurement-data.csv"
)

rater_matrix <- measurement_data[
  c(
    "rater_1",
    "rater_2",
    "rater_3"
  )
]

psych::ICC(
  rater_matrix
)

# Manual two-way ANOVA components
n <- nrow(rater_matrix)
k <- ncol(rater_matrix)

grand_mean <- mean(
  as.matrix(rater_matrix)
)

target_means <- rowMeans(
  rater_matrix
)

rater_means <- colMeans(
  rater_matrix
)

ss_targets <- k * sum(
  (target_means - grand_mean)^2
)

ss_raters <- n * sum(
  (rater_means - grand_mean)^2
)

ss_total <- sum(
  (
    as.matrix(rater_matrix) -
    grand_mean
  )^2
)

ss_error <- (
  ss_total -
  ss_targets -
  ss_raters
)

ms_targets <- ss_targets / (n - 1)
ms_raters <- ss_raters / (k - 1)
ms_error <- ss_error /
  ((n - 1) * (k - 1))

icc_agreement_single <- (
  ms_targets - ms_error
) / (
  ms_targets +
  (k - 1) * ms_error +
  k * (ms_raters - ms_error) / n
)

icc_consistency_single <- (
  ms_targets - ms_error
) / (
  ms_targets +
  (k - 1) * ms_error
)

c(
  agreement_single =
    icc_agreement_single,
  consistency_single =
    icc_consistency_single
)
Selected analysis output
Rater means
Rater 1 = 105.690
Rater 2 = 109.679
Rater 3 = 103.699

ICC(C,1), consistency single = 0.997
ICC(A,1), agreement single = 0.954
ICC(C,3), consistency average = 0.999
ICC(A,3), agreement average = 0.984
Confidence intervals should be calculated from the selected ICC model and software method.
Visualising rater profiles
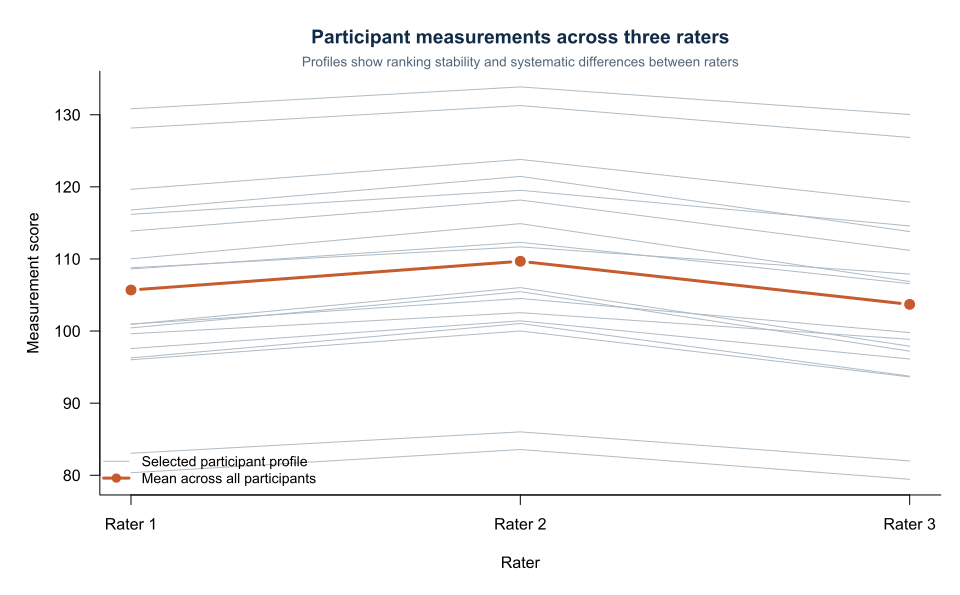
The plot should be used with rater means and difference analyses.
Confidence intervals
Reliability interpretation should focus on the confidence interval, not only the point estimate.
Koo and Li suggest interpreting the lower confidence bound because it reflects the least reliability compatible with the data [3,4].
Universal labels such as poor, moderate, good and excellent remain context dependent.
Sample heterogeneity
ICC can increase when the sample contains a wide score range.
An instrument can show a high ICC in a mixed healthy-and-severe sample but lower reliability within a narrow treatment group.
Report participant characteristics and score distribution. Detailed demonstrations show how ICC changes with variance structure, rater effects and score range [5].
Negative ICC values
Sampling variation or model misspecification can produce negative estimated ICCs.
Possible responses include:
- report the estimate and interval transparently;
- review data and model;
- do not automatically truncate without explanation.
A negative ICC does not mean negative reliability as a physical property; it signals that between-target variance is very small relative to error under the estimator.
Interpreting the output
Presenting the results
Suggested reporting
Report:
- number and selection of targets;
- rater number and sampling;
- measurement conditions;
- exact ICC model;
- consistency or agreement;
- single or average measurement;
- estimate and confidence interval;
- variance components;
- missing ratings.
Follow explicit ICC reporting guidance rather than relying on software shorthand [3,4].
GRRAS recommends reporting the study design, sampling, measurement process, statistical analysis and uncertainty sufficiently clearly for readers to understand what reliability or agreement was evaluated [6].
Reporting templates
Always report the ICC model, definition, unit, estimate, confidence interval, number of targets and number of raters or measurement conditions.
Common mistakes
Knowledge check
Why is consistency ICC higher than agreement ICC?
Answer and reasoning
Consistency ignores systematic rater mean differences, while agreement counts them as error.
When is average-measure ICC appropriate?
Answer and reasoning
When the final measurement used in practice is the average of the specified number of raters or repetitions.
What determines one-way versus two-way ICC?
Answer and reasoning
Whether the same raters assess every target and how the rater effect is modelled.
Why can ICC change across populations?
Answer and reasoning
Between-target variance changes with the score range and participant heterogeneity.
What is incomplete about reporting ICC = 0.95?
Answer and reasoning
The model, agreement definition, single or average unit and confidence interval are missing.
Key take-home messages
References
- Shrout PE, Fleiss JL. Intraclass correlations: uses in assessing rater reliability. Psychol Bull. 1979;86(2):420–428. https://doi.org/10.1037/0033-2909.86.2.420
- McGraw KO, Wong SP. Forming inferences about some intraclass correlation coefficients. Psychol Methods. 1996;1(1):30–46. https://doi.org/10.1037/1082-989X.1.1.30
- Koo TK, Li MY. A guideline of selecting and reporting intraclass correlation coefficients for reliability research. J Chiropr Med. 2016;15(2):155–163. https://doi.org/10.1016/j.jcm.2016.02.012
- Koo TK, Li MY. Erratum to “A guideline of selecting and reporting intraclass correlation coefficients for reliability research”. J Chiropr Med. 2017;16(4):346. https://doi.org/10.1016/j.jcm.2017.10.001
- Liljequist D, Elfving B, Skavberg Roaldsen K. Intraclass correlation—a discussion and demonstration of basic features. PLoS One. 2019;14(7):e0219854. https://doi.org/10.1371/journal.pone.0219854
- Kottner J, Audigé L, Brorson S, et al. Guidelines for Reporting Reliability and Agreement Studies (GRRAS) were proposed. J Clin Epidemiol. 2011;64(1):96–106. https://doi.org/10.1016/j.jclinepi.2010.03.002
These notes support learning and research planning and do not replace statistical consultation for a specific study.