
Part 16 · Module 12
Cost-Effectiveness and Health-Economic Analysis
Learn how cost-effectiveness analysis combines incremental costs and health outcomes, quantifies uncertainty and reports results using net benefit.
Learning outcomes
After completing this lecture, you should be able to:
- Define incremental cost and health effect.
- Calculate and interpret the ICER.
- Explain dominance and extended dominance.
- Use net monetary benefit and willingness-to-pay thresholds.
- Interpret cost-effectiveness planes and acceptability curves.
- Use R code for probabilistic analysis.
Overview
Health-economic evaluation compares costs and outcomes of alternative strategies.
Common analyses include:
- cost-effectiveness analysis;
- cost-utility analysis using QALYs;
- cost–benefit analysis;
- budget-impact analysis.
The incremental cost-effectiveness ratio, ICER, is:
where is incremental cost and incremental health effect.
Why this matters
A treatment can improve health and increase cost.
Decision makers must consider whether additional benefit justifies the additional resources.
ICER interpretation becomes difficult when effects are near zero or when strategies are dominated.
Net benefit often provides a more stable inferential framework.
When to use economic evaluation
Use it when healthcare resources, outcomes and opportunity costs inform a decision.
The perspective may be:
- healthcare payer;
- health system;
- societal;
- patient.
Perspective determines included costs.
Research question and variables
Incremental net monetary benefit is:
where is willingness to pay per health unit.
Positive NMB favours the new strategy at that threshold.
Data structure
Economic-analysis inputs
simulated data| Component | Example |
|---|---|
| Costs | Treatment, hospital, monitoring |
| Outcomes | QALYs or events avoided |
| Time horizon | Lifetime or trial period |
| Discounting | Costs and outcomes |
| Uncertainty | Parameter distributions |
Statistical assumptions
Dominance
A strategy is strongly dominated if it costs more and produces less health.
Extended dominance occurs when a combination of alternatives is more efficient.
Dominated strategies should not define the final ICER frontier.
Worked example
Worked analysis in R
set.seed(20260806)

n_simulation <- 2000

incremental_cost <- rnorm(
  n_simulation,
  mean = 3500,
  sd = 2200
)

incremental_qaly <- rnorm(
  n_simulation,
  mean = 0.18,
  sd = 0.11
)

icer <- mean(
  incremental_cost
) / mean(
  incremental_qaly
)

willingness_to_pay <- 30000

net_benefit <- (
  willingness_to_pay *
  incremental_qaly -
  incremental_cost
)

c(
  mean_incremental_cost =
    mean(incremental_cost),
  mean_incremental_qaly =
    mean(incremental_qaly),
  icer = icer,
  probability_cost_effective =
    mean(net_benefit > 0)
)
Selected analysis output
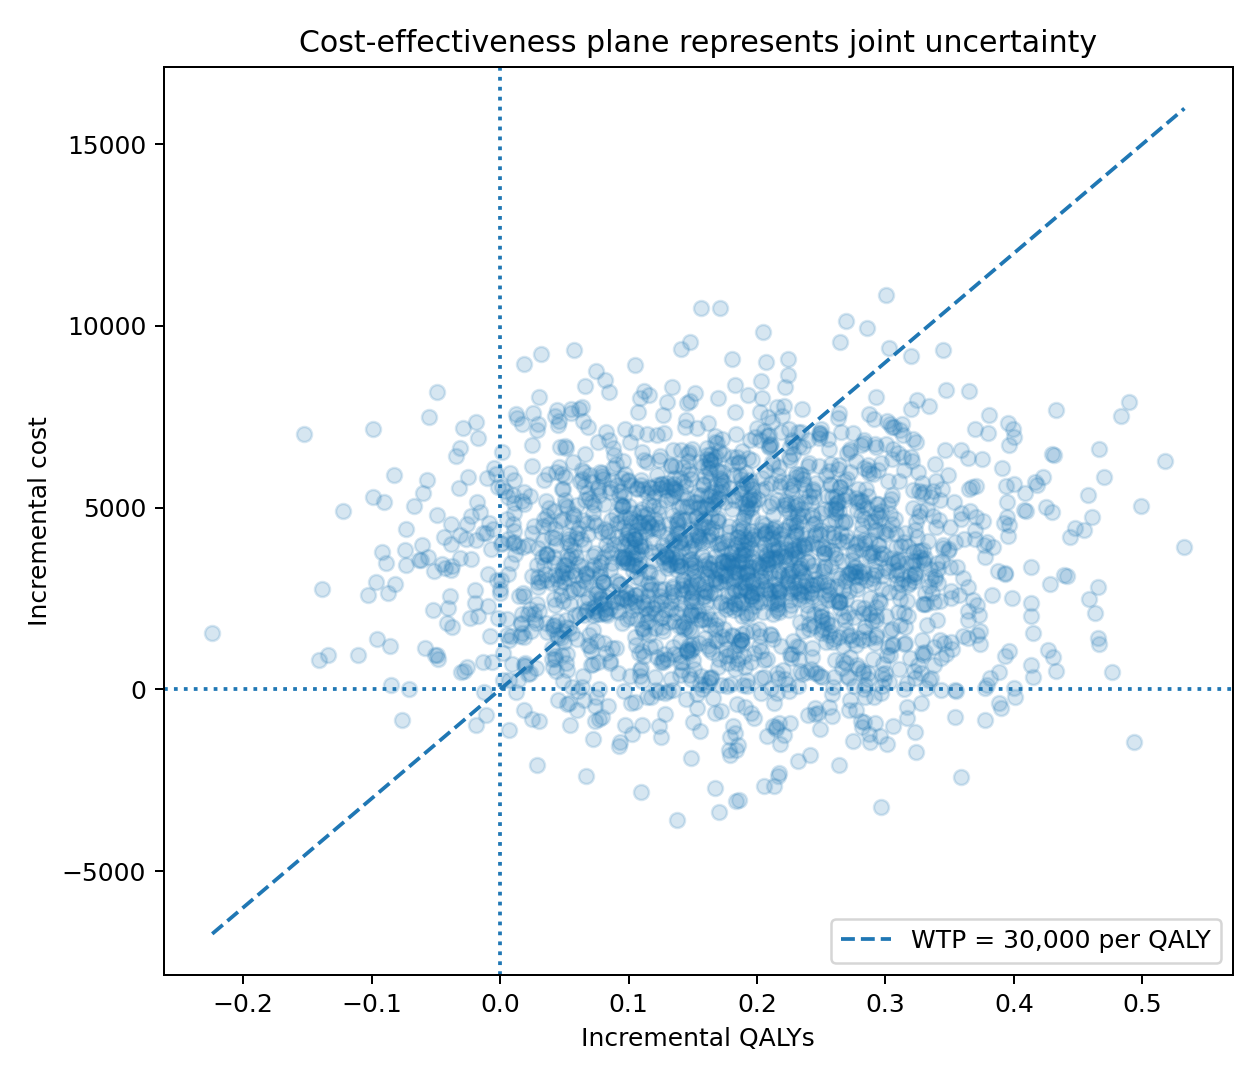
Mean incremental cost ≈ 3,500
Mean incremental QALY ≈ 0.18
ICER ≈ 19,700 per QALY
Probability cost-effective at 30,000 per QALY ≈ 0.66.
Visualising joint uncertainty
Cost-effectiveness acceptability curve
A CEAC plots:
across willingness-to-pay values.
It does not show the magnitude of net benefit or the optimal strategy alone.
Trial-based analysis
Cost data are often skewed and missing.
Use:
- appropriate mean-cost analysis;
- bootstrap or model-based uncertainty;
- multiple imputation;
- joint cost-effect modelling;
- sensitivity analysis beyond trial follow-up.
Median cost is usually not the decision-relevant estimand.
Model-based analysis
Decision models can include:
- decision trees;
- Markov models;
- discrete-event simulation;
- microsimulation.
Validate structure, inputs and code.
Interpreting the output
Presenting the analysis
Suggested reporting
Use CHEERS 2022 [1].
Report decision problem, perspective, comparators, horizon, discounting, model, inputs, currency year, uncertainty, heterogeneity and conflicts.
Standard economic-evaluation, decision-modelling and acceptability-curve methods are developed in specialist sources [2], [3], [4].
Common mistakes
Knowledge check
What is the ICER denominator?
Answer and reasoning
Incremental health effect.
What does positive NMB mean?
Answer and reasoning
The value of incremental health at the threshold exceeds incremental cost.
What is strong dominance?
Answer and reasoning
A strategy costs more and produces less health than another.
What does a CEAC show?
Answer and reasoning
Probability of cost-effectiveness across thresholds.
Why state perspective?
Answer and reasoning
It determines which costs and consequences are included.
Key take-home messages
References
- Husereau D, Drummond M, Augustovski F, et al. CHEERS 2022 statement. BMJ. 2022;376:e067975. https://doi.org/10.1136/bmj-2021-067975
- Drummond MF, Sculpher MJ, Claxton K, Stoddart GL, Torrance GW. Methods for the economic evaluation of health care programmes. 4th ed. Oxford: Oxford University Press; 2015.
- Briggs AH, Claxton K, Sculpher MJ. Decision modelling for health economic evaluation. Oxford: Oxford University Press; 2006.
- Fenwick E, O’Brien BJ, Briggs A. Cost-effectiveness acceptability curves. Health Econ. 2004;13(5):405–415. https://doi.org/10.1002/hec.903
These notes support learning and research planning and do not replace statistical consultation for a specific study.