
Part 16 · Module 5
Joinpoint and Trend Analysis
Learn how joinpoint regression identifies statistically supported changes in temporal trends and reports annual percentage change with multiplicity control.
Learning outcomes
After completing this lecture, you should be able to:
- Explain piecewise linear trend models and joinpoints.
- Interpret annual percentage change and average annual percentage change.
- Describe permutation testing and model selection.
- Recognise sparse-rate, overdispersion and autocorrelation issues.
- Distinguish descriptive trend change from causal intervention effect.
- Use R code for segmented trend analysis.
Overview
Joinpoint regression models a time trend using connected linear segments.
Joinpoints are times at which the slope changes.
The method is widely used for cancer incidence, mortality and surveillance trends [1].
On a log-rate scale, segment slopes can be expressed as annual percentage change, APC.
Why this matters
One average trend can conceal:
- an initial increase;
- a later decline;
- a recent reversal.
Searching many breakpoints without multiplicity control overfits noise.
Joinpoint software uses constrained model selection and permutation tests.
When to use joinpoint analysis
Use joinpoint methods for ordered population rates or counts when:
- meaningful time points are available;
- enough observations support multiple segments;
- a parsimonious trend summary is desired;
- denominators and standardisation are reliable.
Do not use joinpoints alone to infer that a policy caused the slope change.
Research question and variables
A segmented linear model is:
where are joinpoints.
On a log scale:
Data structure
Trend data
simulated data| Variable | Role |
|---|---|
year | Ordered calendar year |
rate | Age-standardised or crude rate |
count | Optional event count |
population | Denominator |
standard_error | Precision of rate |
Statistical assumptions
Worked example
Worked analysis in R
trend_data <- read.csv(
  "data/part-16-joinpoint-data.csv"
)

# Illustrative segmented regression with fixed candidate points
trend_fit <- lm(
  rate ~ year +
    I(pmax(year - 2008, 0)) +
    I(pmax(year - 2016, 0)),
  data = trend_data
)

summary(trend_fit)
confint(trend_fit)

plot(
  trend_data$year,
  trend_data$rate,
  type = "b",
  xlab = "Year",
  ylab = "Rate"
)

lines(
  trend_data$year,
  fitted(trend_fit),
  lty = 2
)

# For formal joinpoint selection use validated
# permutation-based Joinpoint software or a
# prespecified segmented-model procedure.
Selected analysis output
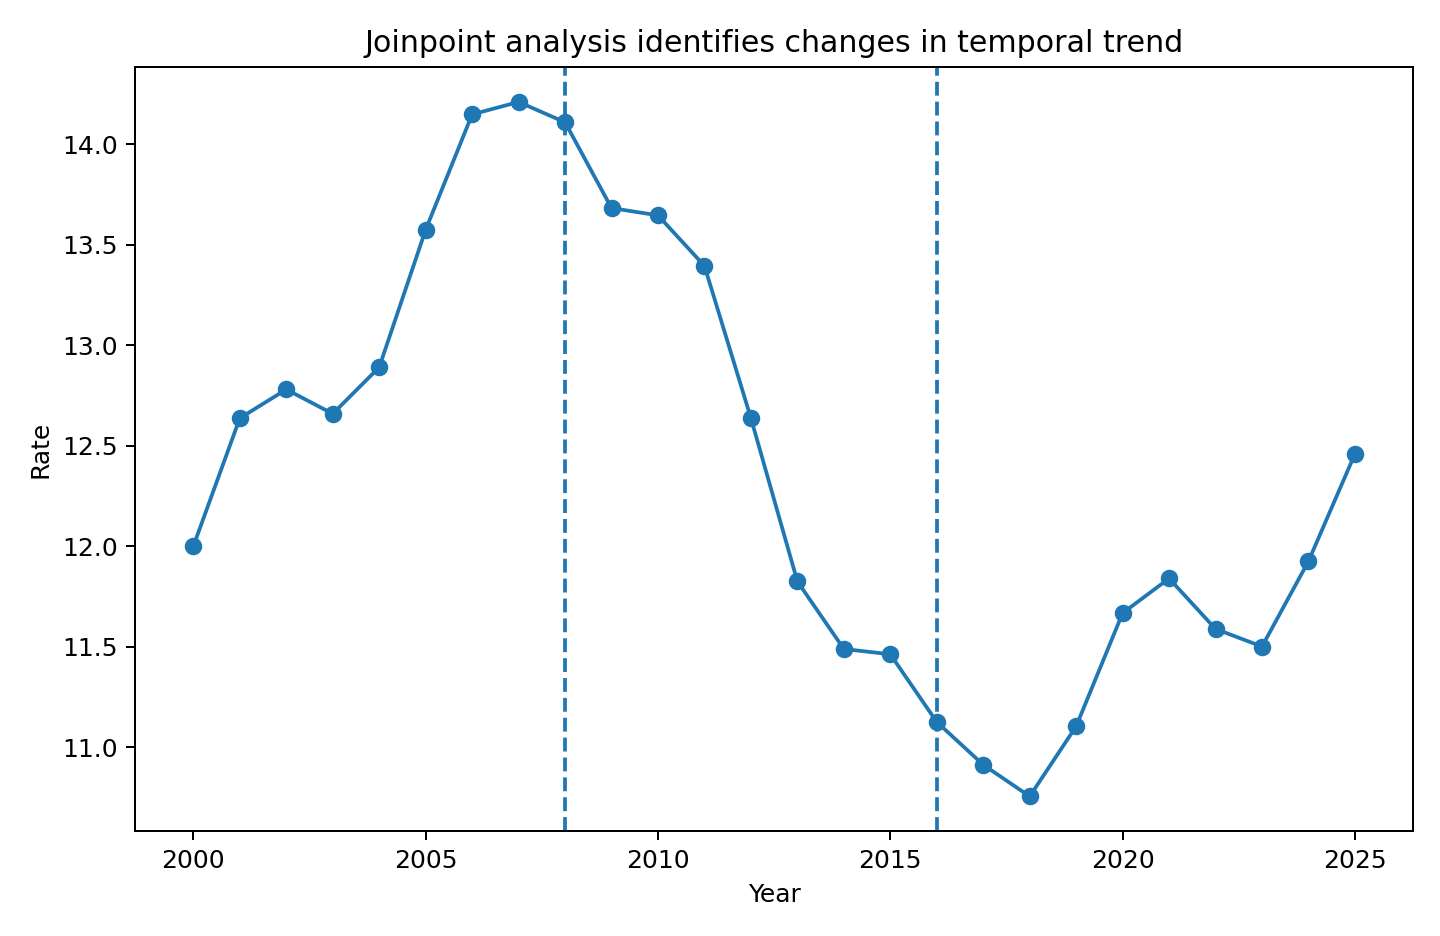
Trend increases before 2008.
Trend declines between 2008 and 2016.
Trend rises slightly after 2016.
Visualising changing trends
APC and AAPC
APC describes one segment.
Average annual percentage change, AAPC, is a weighted geometric summary across segments over a chosen interval.
AAPC can obscure meaningful reversals and should be accompanied by segment APCs.
Model selection
The National Cancer Institute Joinpoint Regression Program uses permutation testing to select the number of joinpoints [2].
Maximum joinpoints should be constrained by:
- number of observations;
- minimum segment length;
- scientific plausibility.
Count and rate models
For event counts with population denominators, Poisson or negative-binomial segmented models may be appropriate.
Weighted least squares can use known rate SEs.
Sparse counts and changing denominators require care.
Interpreting the output
Presenting the analysis
Suggested reporting
Report rate definition, standardisation, denominator, error model, maximum joinpoints, selection method, APCs, AAPC interval and joinpoint uncertainty [1], [2].
AAPC interpretation and alternative segmented-regression estimation are described by Clegg and colleagues and Muggeo [3], [4].
Common mistakes
Knowledge check
What is a joinpoint?
Answer and reasoning
A time where the fitted trend slope changes.
What does APC describe?
Answer and reasoning
The annual percentage change within one fitted segment.
Why constrain the number of joinpoints?
Answer and reasoning
Unrestricted searching overfits random variation.
Does a joinpoint identify a cause?
Answer and reasoning
No.
Why report segment APCs with AAPC?
Answer and reasoning
The average can conceal reversals or heterogeneous trends.
Key take-home messages
References
- Kim HJ, Fay MP, Feuer EJ, Midthune DN. Permutation tests for joinpoint regression. Stat Med. 2000;19(3):335–351. https://doi.org/10.1002/(SICI)1097-0258(20000215)19:3%3C335::AID-SIM336%3E3.0.CO;2-Z
- National Cancer Institute. Joinpoint Regression Program. Statistical Methodology and Applications Branch.
- Clegg LX, Hankey BF, Tiwari R, Feuer EJ, Edwards BK. Estimating average annual per cent change in trend analysis. Stat Med. 2009;28(29):3670–3682. https://doi.org/10.1002/sim.3733
- Muggeo VMR. Estimating regression models with unknown break-points. Stat Med. 2003;22(19):3055–3071. https://doi.org/10.1002/sim.1545
These notes support learning and research planning and do not replace statistical consultation for a specific study.