
Part 11 · Module 9
Screening Programme Measures
Learn how to evaluate screening reach, uptake, positivity, diagnostic completion, detection, false-positive burden, interval disease, outcomes and harms.
Learning outcomes
After completing this lecture, you should be able to:
- Distinguish screening-test accuracy from screening-programme effectiveness.
- Calculate eligibility, invitation, uptake, positivity, completion and detection measures.
- Interpret PPV, false-positive burden and interval disease in a screening pathway.
- Recognise lead-time, length-time, overdiagnosis and healthy-participant biases.
- Evaluate benefits, harms, equity, quality assurance and downstream capacity.
- Use reproducible calculations and visualisations for a screening cascade.
Overview
A screening programme is more than a test.
It includes:
- identifying the target population;
- invitation;
- participation;
- test delivery;
- result communication;
- diagnostic confirmation;
- treatment or surveillance;
- quality assurance;
- outcome monitoring;
- harm reduction.
A highly accurate test can produce little population benefit if uptake is low, follow-up is incomplete or effective treatment is unavailable.
WHO guidance emphasises evaluating the complete organised programme and balancing benefits against harms and resource burden [1].
Why this matters
Test-level measures answer:
- how well the test classifies disease.
Programme-level measures answer:
- who is reached;
- who participates;
- who completes diagnosis;
- who receives treatment;
- whether morbidity or mortality improves;
- what harms and inequalities occur.
A screening programme should not be justified solely by sensitivity, specificity or earlier diagnosis. The classic Wilson–Jungner principles remain a foundational framework for deciding whether screening is appropriate [2].
When to use these measures
Use programme measures when evaluating:
- implementation;
- quality assurance;
- service capacity;
- equity;
- outcomes;
- harms;
- cost-effectiveness;
- continuation or discontinuation.
Do not treat opportunistic testing as equivalent to an organised population programme without defining the pathway and denominator.
Research question and variables
The programme-level questions are:
- What proportion of the target population is eligible, invited and screened?
- How many positive screens, confirmed diagnoses and treatment starts occur?
- What is the false-positive and false-negative burden?
- Are interval disease, advanced disease and mortality reduced?
- Are benefits, harms and access distributed equitably?
Key variables include target-population membership, eligibility, invitation, attendance, screening result, diagnostic completion, confirmed diagnosis, treatment, interval disease and long-term outcomes.
Programme denominators
Every measure requires a defined denominator.
Possible denominators include:
- target population;
- eligible population;
- invited population;
- screened participants;
- positive screens;
- completed diagnostic assessments;
- confirmed cases;
- treated cases;
- person-time after screening.
Changing the denominator changes the interpretation.
Data structure
Simulated screening cascade
simulated dataTable 1. Programme stages
| Stage | People |
|---|---|
| Target population | 10,000 |
| Eligible | 9,200 |
| Invited | 8,500 |
| Attended screening | 5,525 |
| Screen positive | 1,643 |
| Completed diagnostic assessment | 1,479 |
| Confirmed target condition | 335 |
| Started treatment | 295 |
Note: The high positive-screen count reflects moderate specificity in a low-prevalence screening population.
Statistical assumptions
Reach and participation measures
Eligibility proportion
In the example:
Invitation coverage
Uptake among invited
Population coverage
Uptake should be stratified by geography, deprivation, sex, ethnicity, disability and other equity-relevant characteristics where lawful and appropriate.
Test and pathway measures
Positivity rate
A high positivity rate creates diagnostic workload.
Diagnostic-completion rate
Detection rate
Using screened participants as denominator:
PPV of the complete positive pathway
The exact interpretation depends on whether all positive screens completed confirmation and whether missing diagnostic assessments are included.
Worked example
Worked calculations in R
target_population <- 10000
eligible_population <- 9200
invited_population <- 8500
attended_screening <- 5525

prevalence <- 0.08
sensitivity <- 101 / 120
specificity <- 210 / 280

diseased_attendees <- round(
  attended_screening * prevalence
)

nondiseased_attendees <-
  attended_screening -
  diseased_attendees

true_positive_screen <- round(
  diseased_attendees *
  sensitivity
)

false_positive_screen <- round(
  nondiseased_attendees *
  (1 - specificity)
)

screen_positive <-
  true_positive_screen +
  false_positive_screen

diagnostic_completion <- round(
  screen_positive * 0.90
)

confirmed_detection <- round(
  true_positive_screen * 0.90
)

treatment_started <- round(
  confirmed_detection * 0.88
)

programme_measures <- data.frame(
  eligibility = eligible_population /
    target_population,
  invitation_coverage =
    invited_population /
    eligible_population,
  uptake = attended_screening /
    invited_population,
  population_coverage =
    attended_screening /
    eligible_population,
  positivity = screen_positive /
    attended_screening,
  diagnostic_completion =
    diagnostic_completion /
    screen_positive,
  detection_rate =
    confirmed_detection /
    attended_screening,
  treatment_start =
    treatment_started /
    confirmed_detection
)

programme_measures
Selected calculation output
Eligibility proportion = 92.0%
Invitation coverage = 92.4%
Uptake among invited = 65.0%
Population coverage = 60.1%
Positivity rate = 29.7%
Diagnostic completion = 90.0%
Confirmed detection rate = 6.1%
Treatment start among confirmed cases = 88.1%
Visualising the screening cascade
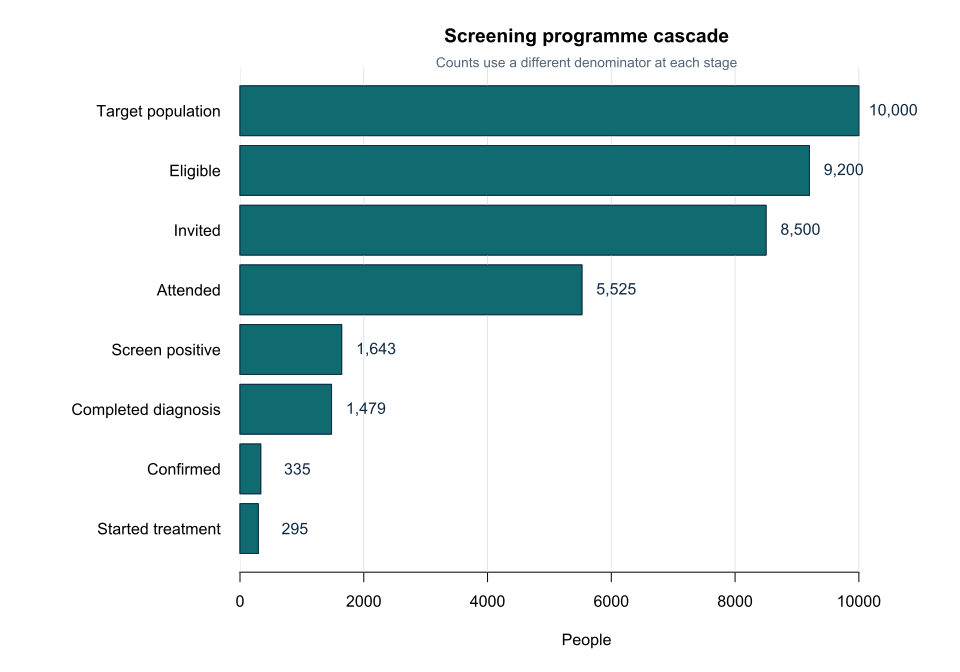
A cascade should report reasons for loss at each stage rather than only the final number treated.
Interval disease
Interval disease is diagnosed after a negative screen and before the next scheduled screening round.
Its rate reflects:
- false-negative tests;
- rapidly developing disease;
- screening interval;
- incomplete registry linkage;
- diagnostic access.
A useful denominator can be:
- negative screens;
- person-years after negative screening.
Definitions and follow-up periods must be standardised.
Lead-time bias
Earlier diagnosis increases observed survival time from diagnosis even if death occurs at the same calendar date.
Therefore:
- longer post-diagnosis survival is not sufficient evidence of screening benefit.
Use mortality, incidence of advanced disease or other population outcomes.
Length-time bias
Screening preferentially detects slower-progressing disease because it remains detectable longer in the preclinical phase.
Screen-detected cases can therefore appear to have better prognosis even without treatment benefit.
Overdiagnosis
Overdiagnosis is detection of disease that would never have caused symptoms or harm during the person’s lifetime.
It is not the same as a false positive.
An overdiagnosed person truly meets the disease definition but does not benefit from detection and may experience treatment harm.
Estimating overdiagnosis generally requires population comparison and long follow-up.
Other harms
Screening harms include:
- false reassurance;
- false-positive anxiety;
- invasive confirmation;
- overdiagnosis;
- overtreatment;
- radiation or procedural risk;
- opportunity cost;
- inequitable access;
- incidental findings.
Programme evaluation should report benefits and harms in comparable absolute terms. Users’ guides to screening recommendations emphasise integrating test performance with programme consequences and evidence of benefit [3].
Effectiveness designs
Strong evidence can come from:
- randomised screening trials;
- controlled programme rollout;
- well-designed cohort linkage;
- case–control mortality studies with careful bias control;
- interrupted time series;
- modelling supported by empirical inputs.
Simple comparison of screen-detected and symptom-detected cases is strongly biased. Screening design, implementation and evaluation are discussed in depth by Raffle, Mackie and Gray [4].
Quality assurance
Monitor:
- specimen quality;
- reading accuracy;
- test failures;
- turnaround time;
- referral delay;
- diagnostic completion;
- treatment delay;
- interval disease;
- stage distribution;
- adverse events;
- equity.
Threshold changes can alter every downstream measure.
Interpreting the programme
Presenting the results
Suggested reporting
WHO screening guidance recommends evaluating programme organisation, evidence, quality assurance, benefits, harms, resource capacity and equity rather than test accuracy alone [1], [5].
Report every cascade denominator and ensure that programme measures are disaggregated where equity gaps may occur.
Common mistakes
Knowledge check
What is invitation uptake?
Answer and reasoning
The proportion of invited people who attend screening.
Why can positive screens be mostly false positives?
Answer and reasoning
The target condition is uncommon and the non-diseased population is much larger.
Is overdiagnosis a false-positive test?
Answer and reasoning
No. The disease is genuinely detected but would never have caused harm.
Why is longer survival after screen detection misleading?
Answer and reasoning
Lead-time and length-time biases can increase observed survival without reducing mortality.
What shows programme benefit most directly?
Answer and reasoning
Improvement in meaningful population outcomes with acceptable harms, not merely earlier detection.
Key take-home messages
References
- World Health Organization Regional Office for Europe. Screening programmes: a short guide. Increase effectiveness, maximize benefits and minimize harm. Copenhagen: WHO Regional Office for Europe; 2020.
- Wilson JMG, Jungner G. Principles and practice of screening for disease. Geneva: World Health Organization; 1968.
- Barratt A, Irwig L, Glasziou P, Cumming RG, Raffle A, Hicks N, et al. Users’ guides to the medical literature: how to use guidelines and recommendations about screening. JAMA. 1999;281(21):2029–2034. https://doi.org/10.1001/jama.281.21.2029
- Raffle AE, Mackie A, Gray JAM. Screening: evidence and practice. 2nd ed. Oxford: Oxford University Press; 2019.
- World Health Organization Regional Office for Europe. A short guide to cancer screening: increase effectiveness, maximize benefits and minimize harm. Copenhagen: WHO Regional Office for Europe; 2022.
These notes support learning and research planning and do not replace statistical consultation for a specific study.