
Part 11 · Module 6
Selecting Diagnostic Cut-Off Values
Learn how to select diagnostic thresholds from intended clinical use, error consequences and target performance rather than relying on one data-driven index.
Learning outcomes
After completing this lecture, you should be able to:
- Explain how changing a threshold alters sensitivity and specificity.
- Calculate and interpret the Youden index.
- Select thresholds using target sensitivity, specificity or error costs.
- Distinguish diagnostic, triage and screening threshold objectives.
- Recognise optimism from selecting and evaluating a threshold in the same data.
- Use R code to evaluate threshold tables and clinically weighted criteria.
Overview
A diagnostic cut-off converts a continuous or ordinal result into a clinical category.
The threshold determines:
- sensitivity;
- specificity;
- PPV and NPV;
- referral volume;
- missed disease;
- false alarms;
- downstream tests;
- treatment consequences.
No threshold is universally optimal.
Threshold selection should follow:
- intended use;
- clinical pathway;
- relative consequences of false negatives and false positives;
- disease prevalence;
- available resources;
- acceptable uncertainty.
Why this matters
The threshold with the largest Youden index gives equal mathematical weight to sensitivity and specificity.
Clinical decisions rarely give equal weight to errors.
Examples:
- a triage test for a dangerous treatable disease may require very high sensitivity;
- an invasive confirmatory pathway may require high specificity;
- screening may prioritise sensitivity but must control false-positive burden;
- resource-limited programmes may require referral capacity constraints.
Selecting a threshold and reporting its accuracy in the same sample produces optimistic performance.
When to select a threshold
Select a threshold when the clinical pathway requires a discrete action:
- no further testing;
- repeat testing;
- referral;
- treatment;
- intensified surveillance.
Retain the continuous result when:
- risk varies gradually;
- several action thresholds are needed;
- prediction probabilities are used directly;
- dichotomisation would discard important information.
Research question and variables
For threshold :
The chosen should satisfy a prespecified clinical objective.
Data structure
Threshold-evaluation table
simulated data| Threshold | Sensitivity | Specificity | Youden index | Expected weighted cost |
|---|---|---|---|---|
| Lower threshold | Higher | Lower | Variable | Depends on prevalence and costs |
| Higher threshold | Lower | Higher | Variable | Depends on prevalence and costs |
A complete threshold table should also include PPV, NPV, positive count and uncertainty.
Statistical assumptions
Youden index
The Youden index is:
It ranges from −1 to 1, with:
- 0 indicating no improvement over chance at that threshold;
- 1 indicating perfect sensitivity and specificity.
The Youden threshold maximises the vertical distance above the no-discrimination ROC diagonal [1].
It does not incorporate prevalence or unequal consequences.
Target sensitivity or specificity
A triage test may require:
The threshold is then selected among values meeting that target, often choosing the highest specificity available.
A confirmatory test may instead require:
The target and acceptable confidence bound should be prespecified.
Cost-weighted threshold
Suppose:
- prevalence ;
- false-negative cost ;
- false-positive cost .
The expected classification cost is:
The selected threshold minimises expected cost under the assumptions.
The costs should represent clinical consequences rather than arbitrary numerical preferences.
Worked example
Worked analysis in R
make_diagnostic_data <- function(n = 400) {
  id <- seq_len(n)
  age <- 20 + ((7 * id) %% 61)
  male <- as.integer(id %% 2 == 0)

  disease <- as.integer(
    ((id * 37) %% 100) < 30
  )

  score_a <-
    47 +
    11 * disease +
    0.08 * (age - 50) +
    7.5 * sin(id * 1.13) +
    3.5 * cos(id * 0.37)

  score_b <-
    48 +
    9 * disease +
    0.05 * (age - 50) +
    7.2 * sin(id * 1.13 + 0.45) +
    4.0 * cos(id * 0.37 + 0.20)

  disease_rank <- (id * 43) %% 100
  nondisease_rank <- (id * 47) %% 100

  reference_positive <- ifelse(
    disease == 1,
    disease_rank < 88,
    nondisease_rank >= 95
  )

  data.frame(
    id = id,
    age = age,
    male = male,
    disease = disease,
    score_a = score_a,
    score_b = score_b,
    reference_positive = as.integer(
      reference_positive
    )
  )
}

diagnostic_data <- make_diagnostic_data()

cutoff_a <- 51.962318662698785
cutoff_b <- 55.26626112612387

diagnostic_data$test_a_positive <- as.integer(
  diagnostic_data$score_a >= cutoff_a
)

diagnostic_data$test_b_positive <- as.integer(
  diagnostic_data$score_b >= cutoff_b
)

library(pROC)

roc_a <- roc(
  diagnostic_data$disease,
  diagnostic_data$score_a,
  levels = c(0, 1),
  direction = "<"
)

youden_coordinates <- coords(
  roc_a,
  x = "best",
  best.method = "youden",
  ret = c(
    "threshold",
    "sensitivity",
    "specificity",
    "ppv",
    "npv"
  ),
  transpose = FALSE
)

youden_coordinates

candidate_thresholds <- sort(
  unique(
    diagnostic_data$score_a
  )
)

threshold_metrics <- do.call(
  rbind,
  lapply(
    candidate_thresholds,
    function(threshold) {
      positive <- as.integer(
        diagnostic_data$score_a >=
          threshold
      )

      tab <- table(
        factor(
          positive,
          levels = c(1, 0)
        ),
        factor(
          diagnostic_data$disease,
          levels = c(1, 0)
        )
      )

      tp <- tab["1", "1"]
      fp <- tab["1", "0"]
      fn <- tab["0", "1"]
      tn <- tab["0", "0"]

      sensitivity <- tp / (tp + fn)
      specificity <- tn / (tn + fp)

      data.frame(
        threshold = threshold,
        sensitivity = sensitivity,
        specificity = specificity,
        youden = sensitivity +
          specificity - 1,
        expected_cost =
          5 * 0.30 *
            (1 - sensitivity) +
          1 * 0.70 *
            (1 - specificity)
      )
    }
  )
)

cost_optimal <- threshold_metrics[
  which.min(
    threshold_metrics$expected_cost
  ),
]

cost_optimal
Selected analysis output
Youden threshold ≈ 51.96
Sensitivity = 0.842
Specificity = 0.750
Youden index = 0.592

Cost-weighted threshold ≈ 48.0
Assumptions: prevalence 0.30; false-negative cost 5; false-positive cost 1
The exact pROC::coords() threshold can differ slightly because ROC packages use midpoint conventions between observed values. Learners can countercheck the classification counts and operating characteristics using the simulated data and code above.
Visualising threshold trade-offs
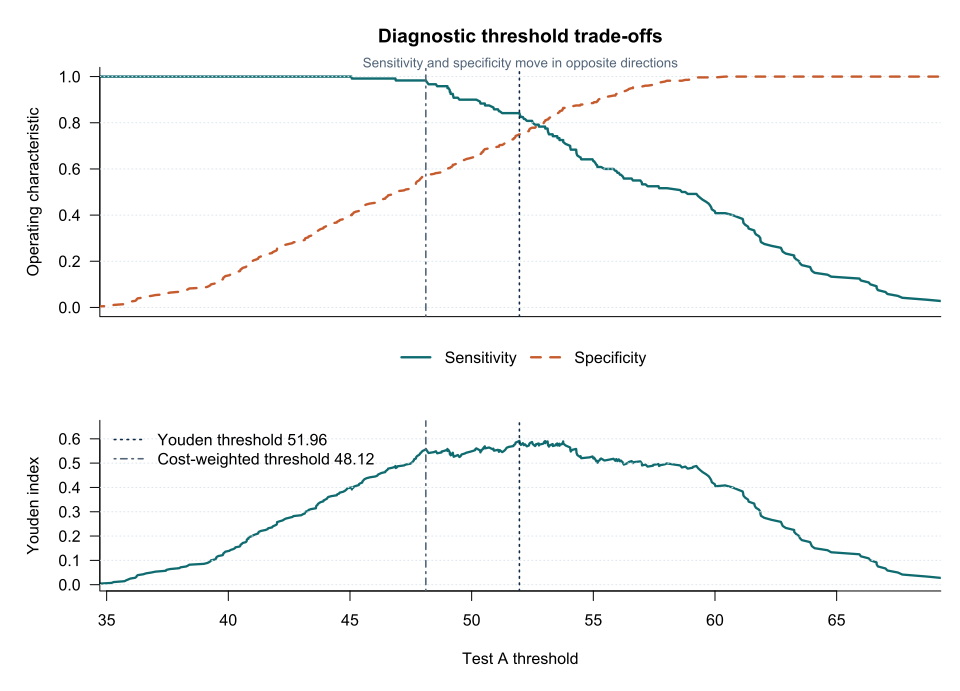
The graph should show the clinically relevant threshold range rather than every extreme value.
Measurement precision
A threshold of 51.962 is not operationally credible if the assay reports only whole units or has substantial analytic variation.
Threshold specification should consider:
- assay repeatability;
- calibration;
- specimen variability;
- reader variability;
- rounding;
- laboratory quality control.
Data-driven optimism
Selecting the threshold with the maximum observed Youden index and reporting the same sample’s performance overestimates future accuracy.
Better approaches include:
- prespecification from prior evidence;
- internal bootstrap correction;
- cross-validation;
- external validation;
- locked threshold evaluation.
Threshold selection is part of model development. Broader statistical evaluation of medical tests and threshold validation is described by Pepe [2].
Multiple thresholds
Some pathways use:
- rule-out threshold;
- indeterminate zone;
- rule-in threshold.
For example:
- low values: no further testing;
- intermediate values: confirmatory test;
- high values: urgent action.
Report interval likelihood ratios or category-specific outcomes rather than forcing one binary cut-off.
Subgroups
A threshold can perform differently by:
- age;
- sex;
- disease subtype;
- setting;
- assay platform.
Subgroup-specific thresholds require strong evidence and may complicate implementation.
Do not search many subgroup cut-offs without validation.
Interpreting the output
Presenting the results
Suggested reporting
Report intended use, threshold derivation, measurement units, operating characteristics with CIs, prevalence, decision weights, indeterminate zone and validation method [3], [4].
STARD requires authors to distinguish prespecified from exploratory thresholds [5].
Common mistakes
Knowledge check
What does the Youden index maximise?
Answer and reasoning
Sensitivity plus specificity minus one.
Why may a triage threshold be lower than the Youden threshold?
Answer and reasoning
Triage can place greater cost on missed disease and therefore prioritise sensitivity.
Why validate a selected threshold separately?
Answer and reasoning
The development-sample optimum is adapted to sampling noise and has optimistic performance.
Does prevalence affect the Youden index?
Answer and reasoning
Not directly, but it affects predictive values and decision-weighted costs.
Why avoid excessive threshold decimals?
Answer and reasoning
The assay’s measurement precision and reproducibility may not support them.
Key take-home messages
References
- Youden WJ. Index for rating diagnostic tests. Cancer. 1950;3(1):32–35. https://doi.org/10.1002/1097-0142(1950)3:1%3C32::AID-CNCR2820030106%3E3.0.CO;2-3
- Pepe MS. The statistical evaluation of medical tests for classification and prediction. Oxford: Oxford University Press; 2003. https://doi.org/10.1093/oso/9780198565826.001.0001
- Perkins NJ, Schisterman EF. The inconsistency of optimal cutpoints obtained using two criteria based on the receiver operating characteristic curve. Am J Epidemiol. 2006;163(7):670–675. https://doi.org/10.1093/aje/kwj063
- Fluss R, Faraggi D, Reiser B. Estimation of the Youden index and its associated cutoff point. Biom J. 2005;47(4):458–472. https://doi.org/10.1002/bimj.200410135
- Cohen JF, Korevaar DA, Altman DG, Bruns DE, Gatsonis CA, Hooft L, et al. STARD 2015 guidelines for reporting diagnostic accuracy studies: explanation and elaboration. BMJ Open. 2016;6:e012799. https://doi.org/10.1136/bmjopen-2016-012799
These notes support learning and research planning and do not replace statistical consultation for a specific study.