
Part 13 · Module 9
Interim Analyses and Data Monitoring
Learn how group-sequential boundaries, alpha spending, independent data monitoring and prespecified decision rules protect participants and trial integrity.
Learning outcomes
After completing this lecture, you should be able to:
- Explain why repeated interim testing inflates type I error.
- Interpret efficacy, futility and safety boundaries.
- Distinguish group-sequential and alpha-spending approaches.
- Describe the role and independence of a data monitoring committee.
- Recognise operational bias from unblinded interim information.
- Use R code to display monitoring boundaries.
Overview
Interim analysis examines accumulating trial data before planned completion.
It may address:
- overwhelming efficacy;
- lack of benefit;
- harm;
- sample-size adaptation;
- design modification.
Repeated ordinary hypothesis testing inflates the probability of a false-positive conclusion.
Group-sequential methods preserve the overall type I error through prespecified boundaries [1].
Why this matters
Unplanned access to comparative data can:
- alter recruitment;
- change co-interventions;
- bias outcome assessment;
- influence analysis decisions;
- inflate type I error.
Interim information should be restricted to an independent body when possible.
When to use interim monitoring
Use formal interim analysis when justified by:
- mortality or severe morbidity;
- long trial duration;
- major ethical implications;
- adaptive design;
- regulatory expectations.
Not every trial requires efficacy monitoring.
Safety monitoring is always required, but it may not use formal group-sequential boundaries.
Research question and variables
Key quantities are:
- information fraction;
- interim test statistic;
- efficacy boundary;
- futility boundary;
- conditional power;
- predictive probability;
- cumulative alpha spent.
Information is often based on:
- events;
- inverse variance;
- effective sample size.
Calendar enrolment fraction may not equal information fraction.
Data structure
Simulated monitoring plan
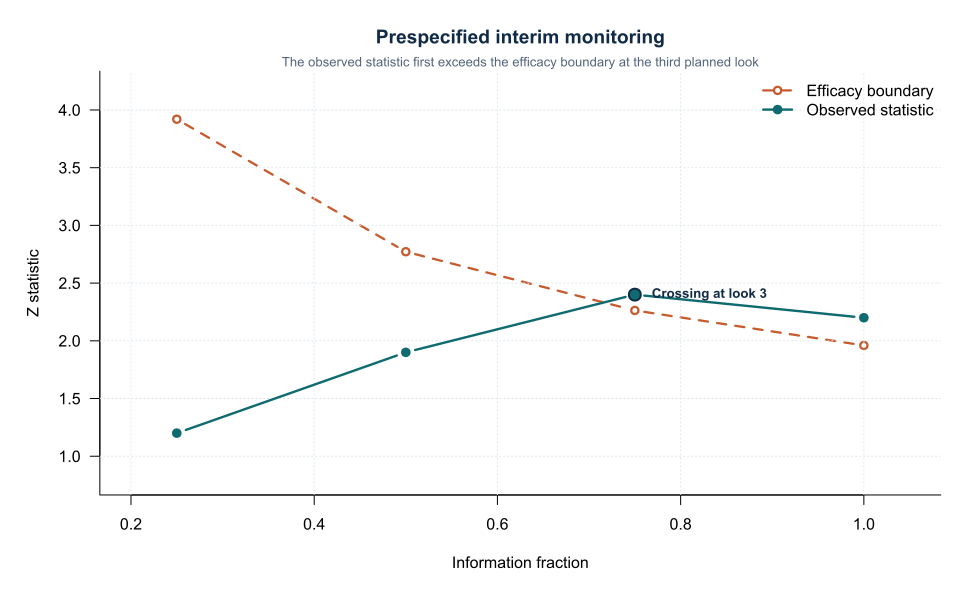
simulated data| Information fraction | Efficacy boundary, z | Observed z |
|---|---|---|
| 0.25 | 3.92 | 1.20 |
| 0.50 | 2.77 | 1.90 |
| 0.75 | 2.26 | 2.40 |
| 1.00 | 1.96 | 2.20 |
The observed statistic crosses the illustrative boundary at 75%.
A real decision would also consider safety, secondary outcomes, data maturity and committee judgement.
Statistical assumptions
Repeated testing
If an ordinary 0.05 test is repeated several times, the chance of at least one false-positive result exceeds 0.05.
A group-sequential design allocates the error probability across analyses.
O’Brien–Fleming boundaries
O’Brien–Fleming boundaries are very stringent early.
They allow stopping only for extremely strong early evidence.
Later boundaries approach the conventional final threshold.
Pocock-type boundaries are more similar across looks and spend more alpha early.
Alpha spending
An alpha-spending function specifies cumulative type I error as information accrues.
It allows flexibility when actual interim timing differs from planned timing.
Futility
Futility rules may use:
- conditional power;
- predictive probability;
- treatment-effect thresholds.
Non-binding futility rules preserve type I error if ignored.
Binding rules require stricter adherence.
Stopping for futility does not prove treatments are equivalent.
Worked example
Worked analysis in R
information_fraction <- c(
  0.25,
  0.50,
  0.75,
  1.00
)

efficacy_boundary <- 1.96 /
  sqrt(
    information_fraction
  )

observed_z <- c(
  1.20,
  1.90,
  2.40,
  2.20
)

data.frame(
  information_fraction,
  efficacy_boundary,
  observed_z,
  crossed = observed_z >
    efficacy_boundary
)

plot(
  information_fraction,
  efficacy_boundary,
  type = "b",
  xlab = "Information fraction",
  ylab = "Standardised test statistic"
)

lines(
  information_fraction,
  observed_z,
  type = "b",
  lty = 2
)
Selected analysis output
Information  Boundary  Observed  Crossed
0.25         3.920     1.20      FALSE
0.50         2.772     1.90      FALSE
0.75         2.263     2.40      TRUE
1.00         1.960     2.20      TRUE
The formula is an educational approximation, not a complete design specification.
Visualising interim monitoring
Data monitoring committee
A DMC typically reviews unblinded comparative data independently of sponsor trial management.
Responsibilities can include:
- participant safety;
- efficacy and futility;
- data quality;
- external evidence;
- recommendation to continue, modify or stop.
The charter should define:
- membership;
- conflicts;
- meeting schedule;
- reports;
- voting;
- communication;
- confidentiality.
Operational bias
Knowledge of interim trends can alter trial conduct.
Only those who need unblinded access should receive it.
Investigators, outcome assessors and sponsor operational teams usually remain blinded.
Estimation after early stopping
Trials stopped early for benefit can overestimate treatment effects.
Report:
- stopping time;
- boundary;
- interim estimate;
- adjusted or repeated confidence intervals where applicable;
- maturity of secondary and safety outcomes.
Interpreting the output
Presenting the results
Suggested reporting
Report timing, information fraction, boundaries, alpha spending, DMC role, access to unblinded data, stopping recommendation and effect estimation after stopping.
FDA guidance emphasises independent monitoring and prespecified procedures [2].
Group-sequential design and the broader statistical principles governing planned interim analyses are developed in specialised guidance [3], [4].
Common mistakes
Knowledge check
Why does repeated testing inflate type I error?
Answer and reasoning
Each additional opportunity can produce a false-positive result under the null.
Why are O'Brien–Fleming boundaries stringent early?
Answer and reasoning
Early stopping requires exceptionally strong evidence while preserving most alpha for later analyses.
What is information fraction?
Answer and reasoning
The proportion of total planned statistical information available, often based on events or variance.
What is the DMC's role?
Answer and reasoning
Independent review of accumulating benefit–risk and trial integrity with recommendations to the sponsor.
Does stopping for futility prove no effect?
Answer and reasoning
No. It indicates low prospect of meeting the planned objective under the chosen rule.
Key take-home messages
References
- O’Brien PC, Fleming TR. A multiple testing procedure for clinical trials. Biometrics. 1979;35(3):549–556. https://doi.org/10.2307/2530245
- US Food and Drug Administration. Establishment and operation of clinical trial data monitoring committees. Silver Spring: FDA; 2006.
- Jennison C, Turnbull BW. Group sequential methods with applications to clinical trials. Boca Raton: Chapman & Hall/CRC; 2000.
- International Council for Harmonisation. ICH E9: statistical principles for clinical trials. Geneva: ICH; 1998.
These notes support learning and research planning and do not replace statistical consultation for a specific study.