
Part 12 · Module 7
Measurement Error and Responsiveness
Learn how to quantify measurement error, minimal detectable change and responsiveness, and distinguish real change from important change.
Learning outcomes
After completing this lecture, you should be able to:
- Distinguish reliability from measurement error.
- Calculate standard error of measurement and minimal detectable change.
- Distinguish minimal detectable change from minimal important change.
- Calculate effect size, standardised response mean and anchor-based discrimination.
- Explain COSMIN responsiveness as validity of change scores.
- Use R code to evaluate test–retest error and change responsiveness.
Overview
Measurement error is the systematic and random error in a participant’s score that is not attributable to true change in the construct.
Responsiveness is the ability of an instrument to detect change over time in the construct it intends to measure [1].
These properties answer different questions:
- How much can a stable participant’s score fluctuate?
- How large must change be to exceed expected error?
- Does the score change in the direction and magnitude predicted by external evidence?
Why this matters
A statistically significant mean change can be smaller than individual measurement error.
A participant’s change can exceed measurement error but still be too small to matter clinically.
Therefore, three concepts must be separated:
- measurement error;
- detectable change;
- important change.
A responsive instrument requires both adequate measurement precision and valid interpretation of change.
When to use these measures
Use measurement-error analysis when repeated measurements are obtained in participants expected to be stable.
Use responsiveness analysis when real change is expected and hypotheses can be specified regarding:
- direction;
- magnitude;
- group differences;
- correlations with other change measures;
- anchor categories.
The test–retest interval should be long enough to prevent recall and short enough to avoid true change.
Research question and variables
The test–retest dataset contains:
- baseline score;
- retest score;
- stable participant condition.
The responsiveness dataset contains:
- baseline score;
- follow-up score;
- change score;
- external improvement anchor.
Change is defined as:
The sign convention must match whether higher scores represent improvement or deterioration.
Data structure
Measurement-error and responsiveness variables
simulated data| Variable | Role |
|---|---|
baseline_measure | Initial score |
retest_measure | Stable retest score |
followup_measure | Later outcome score |
change_score | Follow-up minus baseline |
anchor_improved | External improvement classification |
The stable test–retest sample and responsiveness sample need not always be the same participants.
Statistical assumptions
Standard error of measurement
One common formula is:
This depends on the ICC definition and sample SD.
An alternative model-based SEM can be estimated directly from residual variance.
SEM is expressed in original score units.
Minimal detectable change
For two independent measurement errors:
A change larger than MDC95 is unlikely to arise from measurement error alone under the assumptions. SEM-based criteria for interpreting individual change were developed and evaluated by Wyrwich and colleagues [2].
MDC can be expressed for:
- one individual;
- a group mean;
- a percentage of the scale.
Worked example
Responsiveness measures
Effect size
Standardised response mean
Anchor-based discrimination
ROC AUC can quantify how well change scores distinguish externally classified improved and non-improved participants.
These summary measures depend on the sample’s change variability and anchor. Early responsiveness work emphasised whether an evaluative instrument can detect meaningful change over time [3].
COSMIN recommends evaluating responsiveness through prespecified hypotheses about change-score relationships rather than relying on one universal coefficient [1].
Responsiveness example
Worked analysis in R
responsiveness_data <- read.csv(
  "data/part-12-responsiveness-data.csv"
)

test_retest_matrix <- responsiveness_data[
  c(
    "baseline_measure",
    "retest_measure"
  )
]

icc_output <- psych::ICC(
  test_retest_matrix
)

icc_absolute_single <- 0.9940019168

baseline_sd <- sd(
  responsiveness_data$baseline_measure
)

sem <- baseline_sd *
  sqrt(
    1 - icc_absolute_single
  )

mdc95 <- 1.96 *
  sqrt(2) *
  sem

mean_change <- mean(
  responsiveness_data$change_score
)

sd_change <- sd(
  responsiveness_data$change_score
)

effect_size <- mean_change /
  baseline_sd

standardised_response_mean <-
  mean_change /
  sd_change

roc_change <- pROC::roc(
  responsiveness_data$anchor_improved,
  responsiveness_data$change_score,
  levels = c(0, 1),
  direction = "<"
)

c(
  baseline_sd = baseline_sd,
  sem = sem,
  mdc95 = mdc95,
  mean_change = mean_change,
  effect_size = effect_size,
  srm = standardised_response_mean,
  responsiveness_auc = as.numeric(
    pROC::auc(roc_change)
  )
)
Selected analysis output
Absolute-agreement test–retest ICC = 0.994
Baseline SD = 7.284
SEM = 0.564
MDC95 = 1.564

Mean change = 5.341
Effect size = 0.733
Standardised response mean = 1.506
Anchor AUC = 1.000
The ICC and its confidence interval should be calculated using the chosen ICC specification.
Visualising change and error
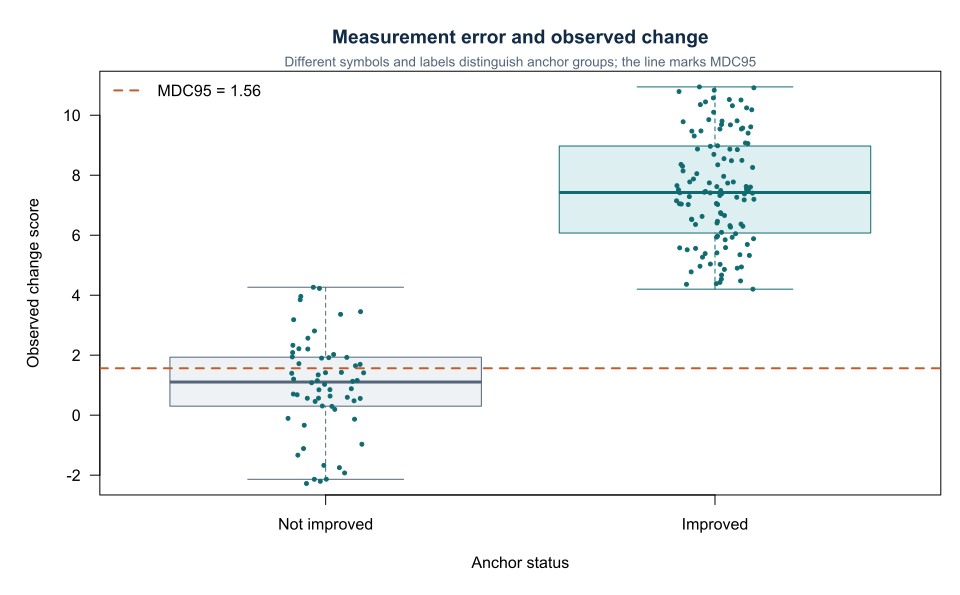
The figure should not label the mean anchor-group difference as the minimal important change automatically.
Minimal important change
Minimal important change, MIC or MCID, is the smallest change considered important by patients, clinicians or decision makers.
Anchor-based approaches can use:
- global rating of change;
- meaningful treatment transition;
- patient acceptable symptom state;
- clinical action threshold.
Recommended approaches to responsiveness and minimally important differences combine anchor-based and distribution-based evidence [4]. The anchor should be:
- interpretable;
- reliable;
- sufficiently correlated with score change;
- independent enough to add external meaning.
Distribution-based measures such as SEM and SRM do not define importance.
MDC versus MIC
Four situations are possible:
- MIC greater than MDC: important change can be distinguished from error.
- MIC close to MDC: individual interpretation is uncertain.
- MIC less than MDC: the instrument cannot reliably detect the important change.
- No credible MIC: report measurement error and responsiveness without inventing a threshold.
Floor and ceiling effects
Participants near score boundaries may have limited room to improve or worsen.
This can reduce responsiveness even when measurement error is small.
Report score distributions and proportion at extremes.
Group versus individual change
The standard error of a group mean is smaller than individual measurement error.
An instrument can detect a small mean treatment effect while being unable to classify individual change reliably.
The analysis should state whether interpretation is at:
- group level;
- individual level.
Interpreting the output
Presenting the results
Suggested reporting
Report stability criteria, retest interval, ICC model, SEM or limits of agreement, MDC, change-score direction, anchor quality, responsiveness hypotheses, confidence intervals, floor or ceiling effects and missing follow-up.
Measurement error and responsiveness should be evaluated as separate but linked properties [1], [5].
Common mistakes
Knowledge check
What does SEM quantify?
Answer and reasoning
Typical measurement error in the score’s original units under the specified reliability model.
What does MDC95 represent?
Answer and reasoning
The magnitude of individual change unlikely to be due to measurement error alone at the 95% level.
Is MDC95 the same as MCID?
Answer and reasoning
No. MDC is statistical detectability; MCID concerns importance.
What does SRM standardise by?
Answer and reasoning
The SD of observed change scores.
Why can a responsive group measure still be poor for individual monitoring?
Answer and reasoning
The group mean can be estimated precisely even when individual measurement error is large.
Key take-home messages
References
- Mokkink LB, Terwee CB, Patrick DL, Alonso J, Stratford PW, Knol DL, et al. The COSMIN checklist for assessing the methodological quality of studies on measurement properties. Qual Life Res. 2010;19(4):539–549. https://doi.org/10.1007/s11136-010-9606-8
- Wyrwich KW, Tierney WM, Wolinsky FD. Further evidence supporting an SEM-based criterion for identifying meaningful intra-individual changes. J Clin Epidemiol. 1999;52(9):861–873. https://doi.org/10.1016/S0895-4356(99)00071-2
- Guyatt G, Walter S, Norman G. Measuring change over time: assessing the usefulness of evaluative instruments. J Chronic Dis. 1987;40(2):171–178. https://doi.org/10.1016/0021-9681(87)90069-5
- Revicki D, Hays RD, Cella D, Sloan J. Recommended methods for determining responsiveness and minimally important differences. J Clin Epidemiol. 2008;61(2):102–109. https://doi.org/10.1016/j.jclinepi.2007.03.012
- de Vet HCW, Terwee CB, Mokkink LB, Knol DL. Measurement in medicine. Cambridge: Cambridge University Press; 2011. https://doi.org/10.1017/CBO9780511996214
These notes support learning and research planning and do not replace statistical consultation for a specific study.