
Part 9 · Module 5
Clustered Data and Multilevel Studies
Learn how multilevel models represent patients within clinics, interpret ICC and design effect, and align cluster-level allocation with analysis.
Learning outcomes
After completing this lecture, you should be able to:
- Identify levels and independent units in clustered studies.
- Interpret participant-level and cluster-level predictors.
- Calculate and interpret variance components and ICC.
- Explain the design effect and importance of cluster count.
- Recognise few-cluster, unequal-size and informative-size problems.
- Use reproducible R code to fit and report a clinic random-intercept model.
Overview
Clustered data arise when participants are grouped within higher-level units such as clinics, schools, households, communities or study sites.
Participants from the same cluster may share:
- population characteristics;
- staff and protocols;
- geography and socioeconomic conditions;
- measurement procedures;
- exposure or intervention.
Multilevel models represent this hierarchy explicitly.
In cluster-randomised trials, treatment is allocated to clusters rather than individuals, so the independent treatment information is driven primarily by the number of clusters.
Why this matters
A study with 24 clinics and 18 participants per clinic contains 432 participant records but only 24 independently allocated clinics.
Ignoring clinic clustering can produce narrow confidence intervals and inflated type I error.
Adding many participants to a small number of clinics often contributes less information than recruiting additional clinics.
When to use this method
Use a multilevel or cluster-aware approach when observations are nested within naturally occurring or randomised clusters.
Examples include:
- patients within clinicians;
- clinicians within hospitals;
- students within schools;
- residents within communities;
- repeated visits within patients within clinics.
Research question and variables
The two-level random-intercept model is:
The intervention coefficient compares adjusted mean outcomes between clinic groups.
Data structure
Two-level clustered data
simulated dataTable 1. Study levels
| Level | Unit | Example variables |
|---|---|---|
| Level 2 | Clinic | Intervention, clinic type, random intercept |
| Level 1 | Participant | Age, sex, systolic blood pressure |
Note: The intervention is constant within every clinic.
A treatment value that changes within a clinic would contradict the stated cluster-randomised design unless crossover or stepped-wedge timing is represented.
Statistical assumptions
Intraclass correlation
For a continuous random-intercept model:
The ICC is outcome-, population- and design-specific. A small ICC can have a large design effect when clusters are large [1].
Worked example
Worked analysis in R
make_cluster_data <- function() {
  records <- vector("list", 24 * 18)
  row_number <- 1

  for (clinic in 1:24) {
    intervention <- as.integer(clinic %% 2 == 0)

    clinic_effect <-
      2.5 * sin(clinic * 0.73) +
      1.2 * cos(clinic * 0.31)

    for (person in 1:18) {
      index <- (clinic - 1) * 18 + person
      age <- 35 + ((7 * index) %% 41)
      male <- as.integer(index %% 2 == 0)

      residual <-
        5 * sin(index * 1.07) +
        2 * cos(person * 0.47)

      sbp <-
        145 -
        5.2 * intervention +
        0.18 * (age - 55) +
        1.5 * male +
        clinic_effect +
        residual

      records[[row_number]] <- data.frame(
        clinic = factor(clinic),
        person = person,
        intervention = factor(
          intervention,
          levels = c(0, 1),
          labels = c("Usual care", "Clinic intervention")
        ),
        age = age,
        male = male,
        sbp = sbp
      )

      row_number <- row_number + 1
    }
  }

  cluster_data <- do.call(rbind, records)
  rownames(cluster_data) <- NULL
  cluster_data
}

cluster_data <- make_cluster_data()

library(lme4)
library(lmerTest)

cluster_fit <- lmer(
  sbp ~ intervention + age + male + (1 | clinic),
  data = cluster_data,
  REML = TRUE
)

summary(cluster_fit)
confint(
  cluster_fit,
  parm = "beta_",
  method = "Wald"
)

variance_components <- as.data.frame(
  VarCorr(cluster_fit)
)

clinic_variance <- variance_components[
  variance_components$grp == "clinic",
  "vcov"
]

residual_variance <- sigma(cluster_fit)^2

icc <- clinic_variance /
  (clinic_variance + residual_variance)

design_effect <- 1 + (18 - 1) * icc

c(
  clinic_variance = clinic_variance,
  residual_variance = residual_variance,
  icc = icc,
  design_effect = design_effect
)
Selected analysis output
Fixed effect                     Estimate   SE       95% CI
Clinic intervention               -5.316    0.916    -7.111 to -3.521
Age                                0.009    0.013    -0.017 to 0.035
Male versus female                 1.249    0.313     0.636 to 1.862

Clinic variance = 4.445
Residual variance = 10.564
ICC = 0.296
Approximate design effect = 6.03
Visualising clinic variation
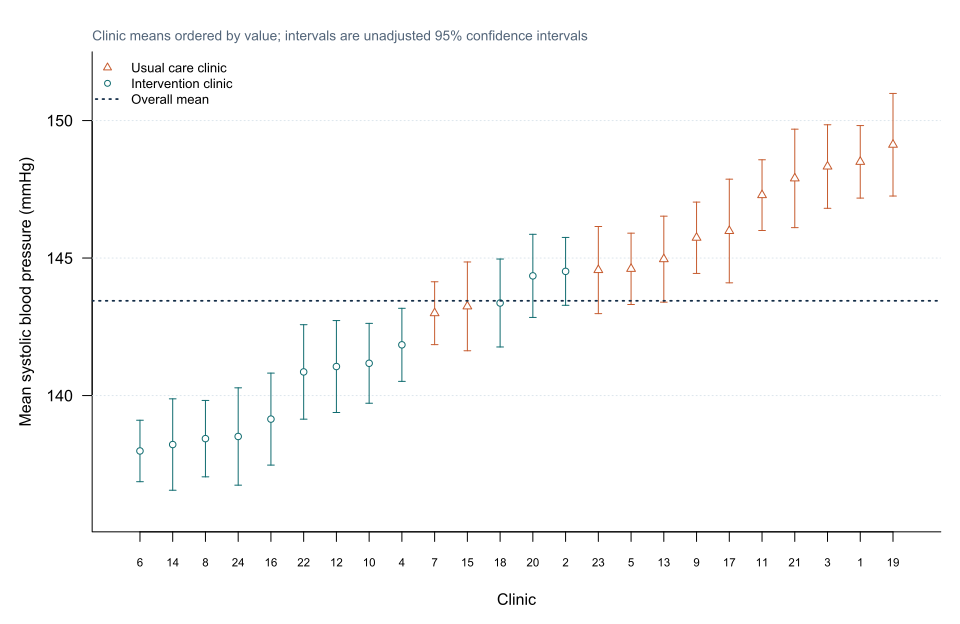
The figure should not be interpreted as a league table. Clinic means differ in case mix and sampling uncertainty.
Individual-level and cluster-level predictors
A participant-level age effect compares participants within and across clinics under the model.
A clinic-level intervention effect compares clinics.
For a participant variable such as socioeconomic status, separate:
- within-clinic individual effect;
- between-clinic contextual effect.
Group-mean centring can distinguish these components.
Ecological and atomistic fallacies
An association between clinic-level smoking prevalence and clinic mean outcome does not prove the same individual-level association.
Conversely, an individual association does not necessarily describe differences between clinics.
The level of the exposure and effect must match the interpretation.
Unequal and informative cluster size
Larger clinics often contribute more participants.
If cluster size is related to outcome after conditioning on the model, standard approaches may target a participant-average effect weighted towards large clusters.
The desired estimand may instead weight clinics equally. Informative cluster size should be considered explicitly.
Few clusters
With few clusters:
- sandwich SEs can be biased;
- variance components are imprecise;
- treatment degrees of freedom are limited;
- chance imbalance between arms can be substantial;
- complex covariate adjustment can be unstable.
Small-sample corrections or cluster-level analysis may be needed.
Interpreting the output
Presenting the results
Suggested reporting
Report number of clusters per arm, participant counts, cluster-size range, allocation level, analysis level, ICC and precision, variance method, small-sample correction and cluster loss [2], [3], [4].
Common mistakes
Knowledge check
What is the independent treatment unit?
Answer and reasoning
The clinic, because intervention is allocated at clinic level.
What does ICC 0.296 mean?
Answer and reasoning
About 29.6% of residual variance under the model is between clinics.
Why does a small ICC still matter with large clusters?
Answer and reasoning
The design effect increases with both ICC and cluster size.
What is a contextual effect?
Answer and reasoning
A between-cluster association that differs from the corresponding within-cluster individual association.
Why are few clusters challenging?
Answer and reasoning
Treatment information and asymptotic variance estimation depend on the number of independent clusters, not merely participant count.
Key take-home messages
References
- Campbell MK, Fayers PM, Grimshaw JM. Determinants of the intracluster correlation coefficient in cluster randomized trials: the case of implementation research. Clin Trials. 2005;2(2):99–107. https://doi.org/10.1191/1740774505cn071oa
- Donner A, Klar N. Design and analysis of cluster randomization trials in health research. London: Arnold; 2000.
- Eldridge SM, Kerry S. A practical guide to cluster randomised trials in health services research. Chichester: Wiley; 2012. https://doi.org/10.1002/9781119966241
- Campbell MK, Piaggio G, Elbourne DR, Altman DG, CONSORT Group. CONSORT 2010 statement: extension to cluster randomised trials. BMJ. 2012;345:e5661. https://doi.org/10.1136/bmj.e5661
These notes support learning and research planning and do not replace statistical consultation for a specific study.