
Part 12 · Module 6
Internal Consistency and Cronbach's Alpha
Learn how Cronbach's alpha summarises multi-item score consistency, its assumptions and limitations, and why structural validity comes first.
Learning outcomes
After completing this lecture, you should be able to:
- Define internal consistency and distinguish it from test–retest reliability.
- Calculate Cronbach's alpha from item variances and total-score variance.
- Interpret corrected item–total correlations and alpha if item deleted.
- Explain the effects of item number, redundancy and multidimensionality.
- Recognise tau-equivalence and ordinal-item limitations.
- Use R code to assess alpha and related item statistics.
Overview
Internal consistency describes the interrelatedness of items intended to measure the same construct.
Cronbach’s alpha is the most widely reported internal-consistency coefficient [1].
Alpha is influenced by:
- average item covariance;
- number of items;
- item variance;
- dimensional structure;
- scoring direction;
- participant heterogeneity.
A high alpha does not prove that a scale is valid or unidimensional.
Structural validity should be established before interpreting internal consistency for a proposed scale or subscale.
Why this matters
Researchers frequently write:
Cronbach’s alpha was 0.92, demonstrating that the questionnaire is valid.
This is incorrect.
Alpha does not establish:
- content validity;
- construct validity;
- test–retest reliability;
- responsiveness;
- one-factor structure.
A long scale with redundant items can have very high alpha while measuring a narrow or poorly defined construct.
When to use Cronbach’s alpha
Use alpha when:
- items contribute to one reflective score;
- structural validity supports sufficient unidimensionality;
- item scoring direction is correct;
- one assessment occasion is analysed;
- participants represent intended use.
Do not calculate one alpha across clearly different subscales merely because the items are in one questionnaire.
Research question and variables
For items:
Alpha increases when items covary strongly and when more items are added.
Data structure
Multi-item questionnaire data
simulated data| Variable | Meaning |
|---|---|
id | Respondent |
item_1 to item_8 | Likert responses scored 1–5 |
total_score | Sum or mean after scoring rules |
| Domain 1 | Items 1–4 |
| Domain 2 | Items 5–8 |
Reverse-worded items must be rescored before analysis.
Statistical assumptions
Tau-equivalence
Classical alpha has a reliability interpretation under assumptions including essentially tau-equivalent items.
Tau-equivalence means items measure the same latent variable with equal true-score loadings, apart from constants.
When loadings differ substantially, alpha can under- or overestimate reliability.
McDonald’s omega can be more appropriate under a factor model with unequal loadings, and practical guidance supports moving from alpha-only reporting to omega when the factor model warrants it [2].
Worked example
Worked analysis in R
questionnaire <- read.csv(
  "data/part-12-questionnaire-data.csv"
)

item_names <- paste0(
  "item_",
  1:8
)

item_data <- questionnaire[
  item_names
]

manual_alpha <- function(data) {
  k <- ncol(data)

  item_variance <- apply(
    data,
    2,
    var
  )

  total_variance <- var(
    rowSums(data)
  )

  k / (k - 1) *
    (
      1 -
      sum(item_variance) /
      total_variance
    )
}

overall_alpha <- manual_alpha(
  item_data
)

domain_1_alpha <- manual_alpha(
  item_data[
    paste0("item_", 1:4)
  ]
)

domain_2_alpha <- manual_alpha(
  item_data[
    paste0("item_", 5:8)
  ]
)

psych_output <- psych::alpha(
  item_data,
  check.keys = FALSE
)

overall_alpha
domain_1_alpha
domain_2_alpha
psych_output$total
psych_output$item.stats
psych_output$alpha.drop
Selected analysis output
Overall alpha = 0.916
Domain 1 alpha = 0.917
Domain 2 alpha = 0.833

Corrected item–total correlations
Item 1  0.778
Item 2  0.791
Item 3  0.770
Item 4  0.780
Item 5  0.691
Item 6  0.722
Item 7  0.616
Item 8  0.629
Bootstrap or analytic confidence intervals should be calculated with the stated method.
Visualising item relationships
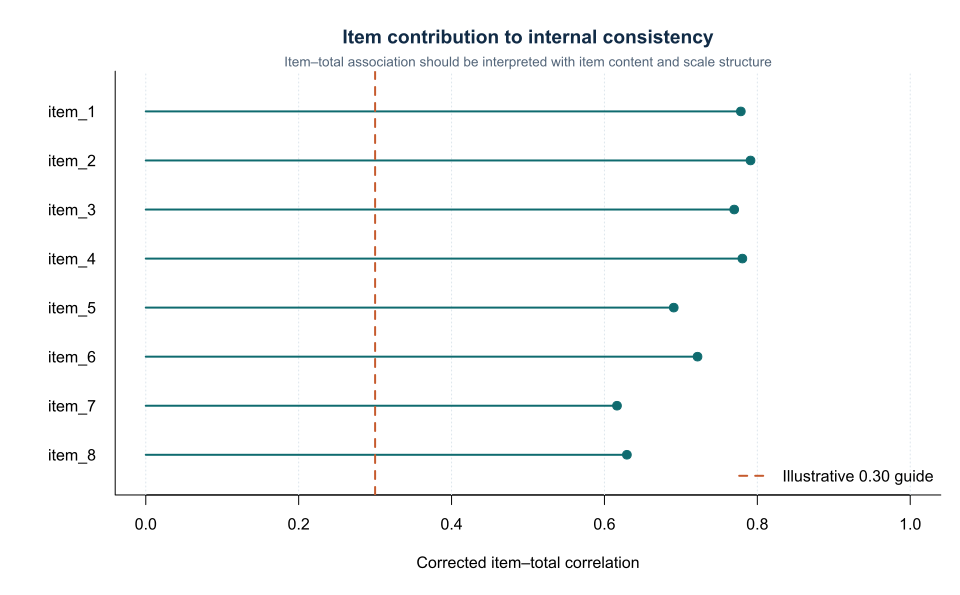
An item-total correlation should be interpreted with item content.
A lower correlation may indicate:
- poor wording;
- incorrect reverse scoring;
- a distinct subdomain;
- floor or ceiling effects;
- genuine clinically important breadth.
Alpha and item number
Alpha can rise simply by adding similar items.
The Spearman–Brown relationship shows why longer scales often have higher reliability.
Excessively high alpha can indicate redundant wording.
One universal acceptable threshold is inappropriate.
The required reliability depends on whether scores are used for:
- group research;
- individual monitoring;
- high-stakes decisions.
Alpha if item deleted
Deleting an item because alpha increases slightly can damage:
- content coverage;
- structural validity;
- comparability;
- interpretability.
Item deletion should consider:
- item relevance;
- comprehension;
- factor loading;
- local dependence;
- response distribution;
- expert and patient feedback.
Ordinal items
Likert items are ordinal.
Ordinary alpha based on Pearson covariance can be acceptable under some score conditions, but ordinal alpha based on polychoric correlations may be considered.
Polychoric methods require adequate sample size and plausible latent-response assumptions.
Report the correlation basis used.
Missing items
Common scoring rules include:
- complete-item requirement;
- prorating after a minimum number answered;
- multiple imputation;
- item-response models.
Alpha calculated after complete-case exclusion can describe a selected sample.
State missing-item handling.
Limitations of alpha
Sijtsma argues that alpha is frequently overused and misinterpreted [3].
McNeish recommends moving beyond ritual reporting of alpha alone and considering model-based reliability such as omega [4].
Internal consistency is one part of measurement quality. Practical explanations of alpha’s interpretation and limitations are provided by Tavakol and Dennick [5].
Interpreting the output
Presenting the results
Suggested reporting
Report:
- construct and structural model;
- item number;
- scoring and reverse coding;
- missing-item handling;
- covariance or correlation type;
- alpha with confidence interval;
- item-total statistics;
- omega or other reliability estimates where appropriate.
Avoid saying that alpha validates a questionnaire.
Common mistakes
Knowledge check
What does alpha summarise?
Answer and reasoning
The covariance-based internal consistency of items contributing to a score under the model assumptions.
Does alpha 0.92 prove one dimension?
Answer and reasoning
No. Correlated dimensions or redundant items can also produce high alpha.
Why might deleting an item be harmful even if alpha increases?
Answer and reasoning
The item may provide important content coverage or a clinically meaningful subdomain.
When is omega useful?
Answer and reasoning
When a factor model with unequal item loadings is more plausible than tau-equivalence.
What should be checked before alpha?
Answer and reasoning
Content validity, item scoring and structural validity of the intended scale or subscale.
Key take-home messages
References
- Cronbach LJ. Coefficient alpha and the internal structure of tests. Psychometrika. 1951;16:297–334. https://doi.org/10.1007/BF02310555
- Dunn TJ, Baguley T, Brunsden V. From alpha to omega: a practical solution to the pervasive problem of internal consistency estimation. Br J Psychol. 2014;105(3):399–412. https://doi.org/10.1111/bjop.12046
- Sijtsma K. On the use, the misuse, and the very limited usefulness of Cronbach’s alpha. Psychometrika. 2009;74:107–120. https://doi.org/10.1007/s11336-008-9101-0
- McNeish D. Thanks coefficient alpha, we’ll take it from here. Psychol Methods. 2018;23(3):412–433. https://doi.org/10.1037/met0000144
- Tavakol M, Dennick R. Making sense of Cronbach’s alpha. Int J Med Educ. 2011;2:53–55. https://doi.org/10.5116/ijme.4dfb.8dfd
These notes support learning and research planning and do not replace statistical consultation for a specific study.