
Part 13 · Module 4
Analysis of Continuous and Binary Trial Outcomes
Learn how to analyse and report continuous and binary outcomes in randomised trials using baseline adjustment, absolute effects and compatible confidence intervals.
Learning outcomes
After completing this lecture, you should be able to:
- Select efficient analyses for continuous trial outcomes.
- Explain why ANCOVA often outperforms change-score comparison.
- Calculate risk difference, risk ratio and odds ratio for binary outcomes.
- Choose effect measures aligned with the estimand.
- Report covariate-adjusted effects and confidence intervals.
- Use R code for continuous and binary trial endpoints.
Overview
Trial outcomes should be analysed using methods aligned with:
- outcome type;
- estimand;
- randomisation design;
- baseline measurement;
- follow-up completeness;
- effect scale.
For continuous outcomes, baseline-adjusted ANCOVA is often efficient.
For binary outcomes, report absolute and relative effects.
A p-value alone is not a trial result.
Why this matters
Common errors include:
- comparing follow-up means without baseline adjustment;
- testing within-group change;
- reporting odds ratios as risk ratios;
- reporting only percentages without denominators;
- presenting statistical significance without clinical magnitude.
The effect estimate and confidence interval should answer the treatment question directly.
When to use these methods
Use ANCOVA when:
- a numerical follow-up outcome is measured;
- baseline value is available;
- treatment was randomised;
- linear-model assumptions are acceptable.
Use binomial models or direct two-group estimators for binary outcomes.
For common outcomes, risk difference and risk ratio are usually more interpretable than odds ratio.
Research question and variables
Continuous estimand:
Adjusted mean difference in follow-up outcome between assigned groups.
Binary estimands:
- risk difference;
- risk ratio;
- odds ratio.
The binary threshold should be clinically justified and prespecified.
Data structure
Trial outcome variables
simulated data| Variable | Role |
|---|---|
group | Assigned treatment |
baseline | Baseline continuous outcome |
outcome_cont | Follow-up continuous outcome |
binary_event | Follow-up success indicator |
site | Randomisation stratum |
Statistical assumptions
Continuous outcome analysis
The ANCOVA model is:
is the adjusted treatment mean difference.
Baseline adjustment improves precision when baseline predicts follow-up.
Binary effect measures
The odds ratio is:
OR can be much farther from one when outcomes are common.
Worked example
Worked analysis in R
trial <- read.csv(
  "data/part-13-trial-data.csv"
)

continuous_data <- trial[
  !is.na(trial$outcome_cont),
]

continuous_fit <- lm(
  outcome_cont ~ group +
    baseline +
    factor(site),
  data = continuous_data
)

coef(
  summary(continuous_fit)
)

confint(
  continuous_fit
)

binary_table <- with(
  continuous_data,
  table(
    group,
    binary_event
  )
)

risk_control <- binary_table["0", "1"] /
  sum(binary_table["0",])

risk_intervention <- binary_table["1", "1"] /
  sum(binary_table["1",])

risk_difference <-
  risk_intervention -
  risk_control

risk_ratio <-
  risk_intervention /
  risk_control

odds_ratio <- (
  binary_table["1", "1"] *
  binary_table["0", "0"]
) / (
  binary_table["1", "0"] *
  binary_table["0", "1"]
)

c(
  risk_control = risk_control,
  risk_intervention = risk_intervention,
  risk_difference = risk_difference,
  risk_ratio = risk_ratio,
  odds_ratio = odds_ratio
)
Selected analysis output
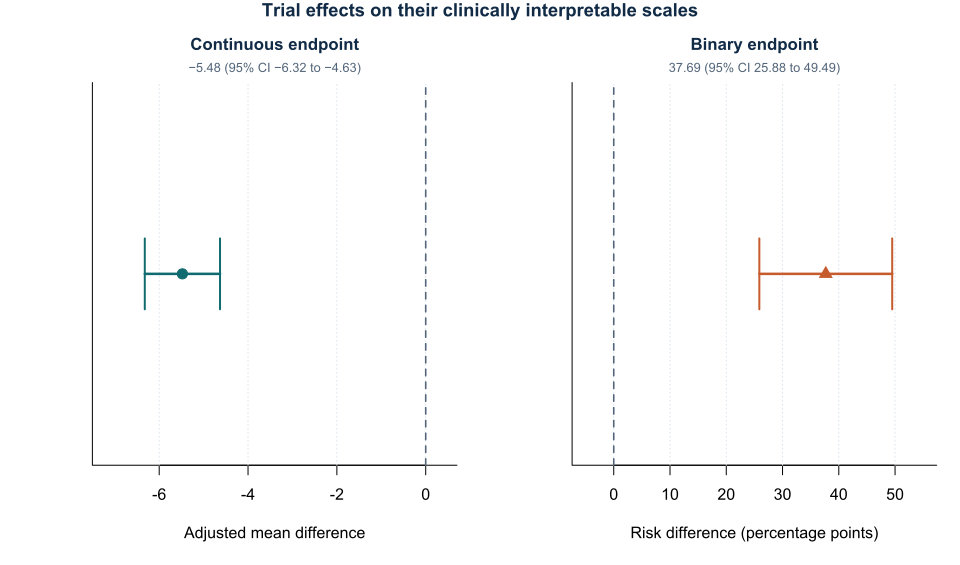
Adjusted mean difference = -5.478
95% CI = -6.324 to -4.631
p < 0.001

Control risk = 0.207
Intervention risk = 0.584
Risk difference = 0.377
Risk ratio = 2.819
Odds ratio = 5.373
Visualising trial effects
Missing outcomes
Complete-record analysis is shown for teaching.
A primary trial analysis should use the prespecified missing-data approach.
Sensitivity analyses can include:
- multiple imputation;
- mixed models;
- delta adjustment;
- tipping-point analysis.
The analysis should remain aligned with the estimand’s intercurrent-event strategy.
Interpreting the output
Presenting the results
Suggested reporting
Report group counts, observed outcome summaries, adjusted effect, confidence interval, analysis population, covariates and missing-data sensitivity.
ICH E9 emphasises effect estimation aligned with the estimand [1].
Baseline-adjusted analysis, the limitations of change scores and sensitivity analysis for missing trial outcomes are discussed in methodological guidance [2], [3], [4].
Common mistakes
Knowledge check
Why use ANCOVA?
Answer and reasoning
It estimates the between-group follow-up difference while improving precision through baseline prognosis.
What does risk difference measure?
Answer and reasoning
The absolute difference in outcome probabilities between groups.
Why can OR exaggerate RR?
Answer and reasoning
Odds diverge from probabilities when outcomes are common.
Does within-group improvement prove treatment benefit?
Answer and reasoning
No. The direct between-group contrast is required.
What should accompany every effect estimate?
Answer and reasoning
A compatible confidence interval and clear analysis population.
Key take-home messages
References
- International Council for Harmonisation. ICH E9: statistical principles for clinical trials. Geneva: ICH; 1998.
- Vickers AJ, Altman DG. Analysing controlled trials with baseline and follow-up measurements. BMJ. 2001;323:1123–1124. https://doi.org/10.1136/bmj.323.7321.1123
- Senn S. Change from baseline and analysis of covariance revisited. Stat Med. 2006;25(24):4334–4344. https://doi.org/10.1002/sim.2682
- Morris TP, Kahan BC, White IR. Choosing sensitivity analyses for randomised trials with missing data. BMC Med Res Methodol. 2014;14:8. https://doi.org/10.1186/1471-2288-14-8
These notes support learning and research planning and do not replace statistical consultation for a specific study.