
Part 12 · Module 1
Reliability versus Agreement
Learn why reliability describes relative ranking while agreement describes closeness of measurements, and why correlation alone is inadequate.
Learning outcomes
After completing this lecture, you should be able to:
- Distinguish reliability from absolute agreement.
- Explain relative and absolute measurement error.
- Recognise why high correlation can coexist with clinically unacceptable disagreement.
- Match categorical and numerical data to suitable reliability or agreement methods.
- Identify the role of participant heterogeneity in reliability estimates.
- Use R code and graphics to compare association with agreement.
Overview
Reliability and agreement are related but different measurement properties.
Reliability describes how well a measurement distinguishes participants from one another despite measurement error.
Agreement describes how close repeated measurements, raters or methods are in the original measurement units.
A set of measurements can preserve participant ranking and therefore have high reliability while differing systematically by a clinically important amount.
COSMIN places reliability and measurement error within the reliability domain but treats them as distinct properties [1]. The distinction is essential when deciding whether measurements are interchangeable.
Why this matters
Suppose Method B is always approximately 10 units higher than Method A.
Participants can retain almost exactly the same ranking, producing:
- very high correlation;
- high consistency reliability;
- poor absolute agreement.
Correlation is therefore not an agreement statistic.
Clinical use determines which property matters:
- ranking patients for research may prioritise reliability;
- replacing one device with another requires acceptable agreement;
- detecting change requires measurement error small enough to distinguish real change.
When to use this framework
Use the framework before selecting any reliability statistic.
Ask:
- Is the outcome categorical, ordinal or numerical?
- Are the same raters or methods of direct interest?
- Must measurements be exactly interchangeable?
- Is the result for one measurement or an average?
- Is the aim ranking, reproducibility, agreement or change detection?
- Are participants representative of the intended score range?
Research question and variables
The example contains:
- one participant identifier;
- Method A numerical measurement;
- Method B numerical measurement.
Two questions are different:
Do the methods rank participants similarly?
and:
Are the measurements close enough to be used interchangeably?
The first can be informed by correlation or a consistency ICC. The second requires absolute-agreement methods such as an agreement ICC and Bland–Altman analysis.
Data structure
Method-comparison variables
simulated data| Variable | Role |
|---|---|
id | Participant identifier |
method_a | First numerical method |
method_b | Second numerical method |
difference | Method B minus Method A |
mean_pair | Mean of both methods |
Both methods must be measured on the same participants and in comparable conditions.
Statistical assumptions
Why participant heterogeneity matters
A reliability coefficient is a variance ratio.
If participants vary greatly in true scores, the between-participant variance is large and reliability can be high even when measurement error is unchanged.
In a homogeneous clinical subgroup, the same instrument can produce a lower reliability coefficient.
Therefore, reliability is population dependent.
Agreement measures such as limits of agreement remain in the original units and are often easier to compare with clinical tolerances.
Correlation is not agreement
Pearson correlation measures linear association.
It is unchanged when one method adds a constant:
or rescales values:
provided the linear relationship remains strong.
Neither transformation preserves absolute agreement.
Bland and Altman developed a difference-based method specifically because correlation can be misleading in method-comparison studies [2].
Worked example
Worked analysis in R
Download the lecture dataset using the Dataset link on this page and save it in the R working directory before running the code.
measurement_data <- read.csv(
  "part-12-continuous-measurement-data.csv"
)

correlation <- cor.test(
  measurement_data$method_a,
  measurement_data$method_b,
  method = "pearson"
)

difference <- with(
  measurement_data,
  method_b - method_a
)

pair_mean <- with(
  measurement_data,
  (method_a + method_b) / 2
)

bias <- mean(difference)
sd_difference <- sd(difference)
limits <- bias + c(-1, 1) *
  1.96 * sd_difference

proportional_bias <- lm(
  difference ~ pair_mean
)

correlation
c(
  bias = bias,
  lower_limit = limits[1],
  upper_limit = limits[2]
)
summary(proportional_bias)
Selected analysis output
Pearson r = 0.996

Mean difference = 10.214
Lower limit of agreement = 7.401
Upper limit of agreement = 13.026

Proportional-bias slope = 0.042
p < 0.001
Visualising reliability and agreement
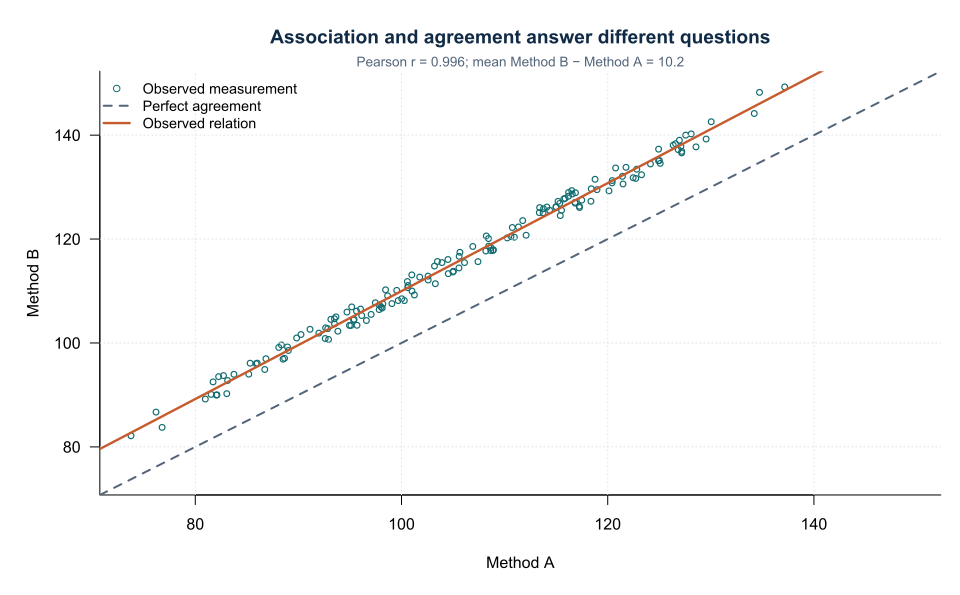
The identity line represents perfect agreement.
The observed regression line is displaced above it, showing systematic bias.
Choosing the statistic
Reliability terminology
Common contexts include:
- inter-rater reliability;
- intra-rater reliability;
- test–retest reliability;
- inter-method reliability;
- internal consistency.
These are not interchangeable.
The design must state:
- who or what is repeated;
- how many repetitions occur;
- whether raters are fixed or sampled;
- whether exact equality is required;
- whether one measurement or an average will be used.
Koo and Li emphasise reporting the exact ICC model, definition and measurement unit because “the ICC” is not one statistic [3].
Interpreting the output
Presenting the results
Suggested reporting
Report:
- design and repeated unit;
- participant spectrum;
- measurement conditions;
- reliability and agreement estimands;
- confidence intervals;
- clinically acceptable error;
- handling of repeated observations;
- graphs of paired measurements and differences.
Reliability estimates should never be reported without their exact model and intended measurement use [1], [3]. Agreement and reliability measures should be chosen according to the intended interpretation rather than treated as interchangeable [4].
Common mistakes
Knowledge check
Why can correlation remain high when one method is consistently 10 units higher?
Answer and reasoning
Correlation depends on the linear ranking pattern, not the distance from the identity line.
Which property matters when replacing one device with another?
Answer and reasoning
Absolute agreement in clinically meaningful units.
Why is reliability population dependent?
Answer and reasoning
It compares measurement error with between-participant variation, which changes across populations.
Does a non-significant paired mean difference prove agreement?
Answer and reasoning
No. It only addresses average bias and may have low power; individual differences can still be unacceptably wide.
What must accompany an ICC report?
Answer and reasoning
The model, type, agreement definition, single or average measurement, estimate and confidence interval.
Key take-home messages
References
- Mokkink LB, Terwee CB, Patrick DL, Alonso J, Stratford PW, Knol DL, et al. The COSMIN checklist for assessing the methodological quality of studies on measurement properties. Qual Life Res. 2010;19(4):539–549. https://doi.org/10.1007/s11136-010-9606-8
- Bland JM, Altman DG. Statistical methods for assessing agreement between two methods of clinical measurement. Lancet. 1986;1(8476):307–310. https://doi.org/10.1016/S0140-6736(86)90837-8
- Koo TK, Li MY. A guideline of selecting and reporting intraclass correlation coefficients for reliability research. J Chiropr Med. 2016;15(2):155–163. https://doi.org/10.1016/j.jcm.2016.02.012
- de Vet HCW, Terwee CB, Knol DL, Bouter LM. When to use agreement versus reliability measures. J Clin Epidemiol. 2006;59(10):1033–1039. https://doi.org/10.1016/j.jclinepi.2005.10.015
These notes support learning and research planning and do not replace statistical consultation for a specific study.