
Part 16 · Module 7
Network Meta-Analysis Overview
Learn how network meta-analysis combines direct and indirect comparisons across multiple treatments under transitivity, consistency and connected-network assumptions.
Learning outcomes
After completing this lecture, you should be able to:
- Explain direct and indirect evidence.
- Define transitivity and consistency.
- Read a treatment network plot.
- Distinguish relative effects from treatment rankings.
- Recognise disconnected networks and effect modifiers.
- Plan transparent network meta-analysis reporting.
Overview
Network meta-analysis, NMA, compares several treatments simultaneously.
It combines:
- direct evidence from head-to-head trials;
- indirect evidence through common comparators.
For example, A versus C can be informed by A versus B and B versus C.
Why this matters
Indirect comparison is valid only when treatment comparisons are sufficiently exchangeable.
Differences in effect modifiers can violate transitivity.
Treatment rankings can appear precise even when the evidence is sparse or biased.
When to use NMA
Use NMA when:
- more than two relevant treatments exist;
- a connected trial network is available;
- effect measures are compatible;
- transitivity is plausible;
- trial and treatment definitions are coherent.
A disconnected network cannot provide all relative comparisons without additional assumptions.
Research question and variables
If treatment B is the common comparator:
on an additive effect scale.
Consistency means direct and indirect evidence agree within sampling variation.
Data structure
Network meta-analysis inputs
simulated data| Variable | Meaning |
|---|---|
| Study | Trial identifier |
| Arm | Treatment |
| Outcome | Arm-level or contrast-level result |
| Effect modifiers | Baseline risk, dose, follow-up |
| Multi-arm indicator | Shared trial correlation |
Statistical assumptions
Transitivity
Transitivity is a clinical and design assumption.
Ask whether a patient in an A-versus-B trial could reasonably have been randomised to C in another trial.
Important modifiers include:
- disease severity;
- previous treatment;
- dose;
- outcome timing;
- baseline risk;
- co-intervention.
Consistency
Consistency can be examined using:
- node splitting;
- design-by-treatment interaction;
- inconsistency models;
- comparison of direct and indirect estimates.
A non-significant inconsistency test does not prove consistency.
Worked example
Worked analysis in R
network_data <- read.csv(
  "data/part-16-network-meta-analysis-data.csv"
)

network_data

# Contrast-based illustration with netmeta:
# library(netmeta)
# net <- pairwise(
#   treat = treatment,
#   event = event,
#   n = n,
#   studlab = study,
#   data = arm_data,
#   sm = "RR"
# )
# fit <- netmeta(
#   TE,
#   seTE,
#   treat1,
#   treat2,
#   studlab,
#   data = net,
#   random = TRUE
# )
# netgraph(fit)
# netsplit(fit)
Selected analysis output
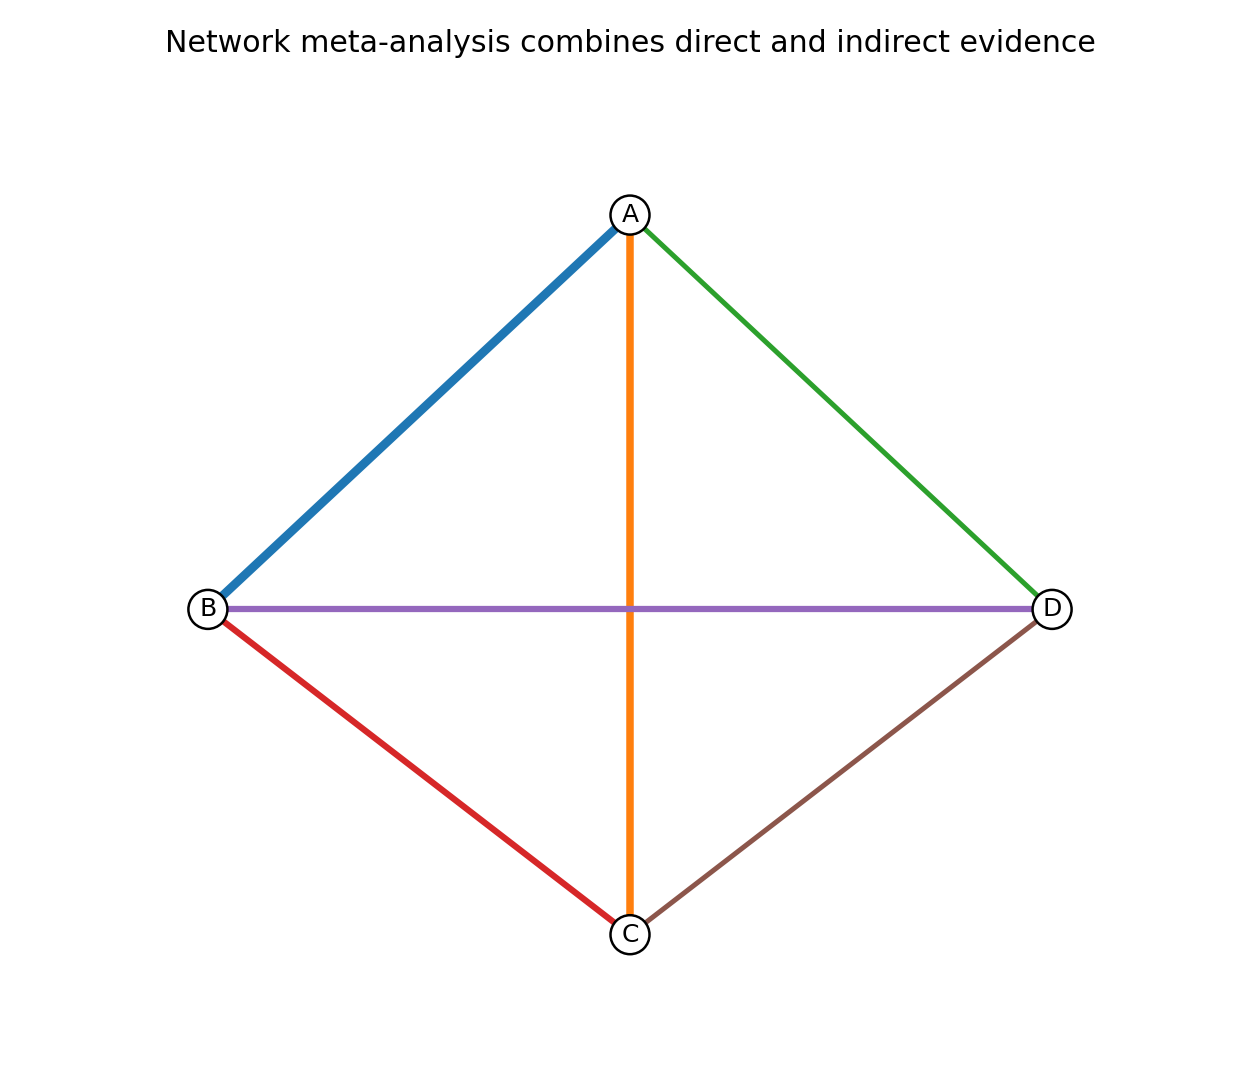
The simulated four-treatment network is connected.
The A–B comparison contains the largest number of direct studies.
Visualising the treatment network
Rankings
Rank probabilities, SUCRA and P-scores summarise relative ordering.
They can be misleading when:
- effects are clinically similar;
- uncertainty is large;
- outcomes differ in importance;
- safety is omitted;
- evidence quality varies.
Report relative effects and confidence or credible intervals before rankings.
Multi-arm trials
Multi-arm trials contribute correlated comparisons.
Treating each contrast as independent double-counts shared groups.
NMA software must model the covariance.
Interpreting the output
Presenting the analysis
Suggested reporting
Use PRISMA-NMA and assess certainty for each comparison [1], [2].
Report network geometry, transitivity, inconsistency, heterogeneity, rankings and risk of bias.
The netmeta implementation and graphical tools for evaluating network geometry provide practical extensions [3], [4].
Common mistakes
Knowledge check
What is transitivity?
Answer and reasoning
The assumption that indirect comparisons are valid because relevant effect modifiers are sufficiently comparable across trial contrasts.
What is consistency?
Answer and reasoning
Agreement between direct and indirect evidence for the same treatment contrast.
Why can rankings mislead?
Answer and reasoning
They may conceal small effect differences, uncertainty and evidence quality.
What is needed for all pairwise comparisons?
Answer and reasoning
A connected network and valid transitivity assumptions.
Why model multi-arm correlation?
Answer and reasoning
Contrasts sharing one trial arm are statistically dependent.
Key take-home messages
References
- Hutton B, Salanti G, Caldwell DM, Chaimani A, Schmid CH, Cameron C, et al. PRISMA extension for network meta-analysis. Ann Intern Med. 2015;162(11):777–784. https://doi.org/10.7326/M14-2385
- Salanti G. Indirect and mixed-treatment comparison, network, or multiple-treatments meta-analysis. Res Synth Methods. 2012;3(2):80–97. https://doi.org/10.1002/jrsm.1054
- Rücker G, Krahn U, König J, Efthimiou O, Davies A, Papakonstantinou T, et al. netmeta: network meta-analysis using frequentist methods. R package.
- Chaimani A, Higgins JPT, Mavridis D, Spyridonos P, Salanti G. Graphical tools for network meta-analysis. PLoS One. 2013;8(10):e76654. https://doi.org/10.1371/journal.pone.0076654
These notes support learning and research planning and do not replace statistical consultation for a specific study.