
Part 16 · Module 6
Meta-Analysis and Forest Plots
Learn how fixed- and random-effects meta-analysis combine effect estimates, quantify heterogeneity and present study results in a forest plot.
Learning outcomes
After completing this lecture, you should be able to:
- Define inverse-variance meta-analysis.
- Distinguish fixed-effect and random-effects models.
- Calculate Q, tau-squared and I-squared.
- Interpret study weights and pooled confidence intervals.
- Read and construct a forest plot.
- Use R code with metafor.
Overview
Meta-analysis combines effect estimates from multiple studies addressing a sufficiently similar question.
Each study contributes:
- an effect estimate;
- a standard error or variance;
- design and risk-of-bias information.
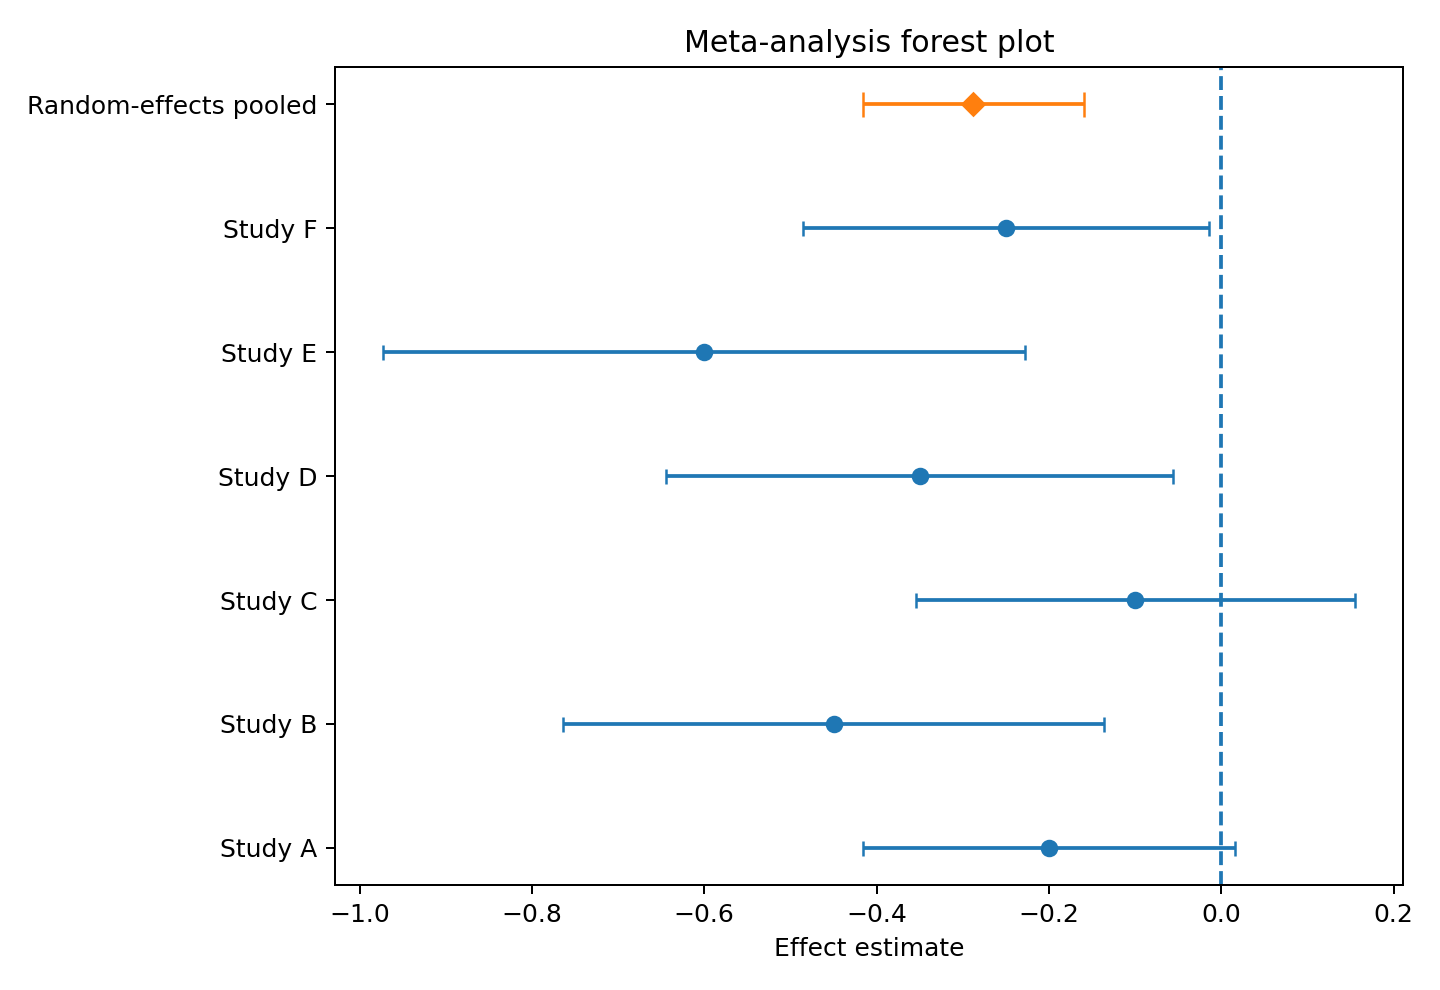
A forest plot displays individual and pooled effects.
Statistical pooling should follow a structured review and should not substitute for clinical judgement about comparability.
Why this matters
A pooled estimate can be precise but misleading when studies differ in:
- populations;
- interventions;
- outcomes;
- follow-up;
- bias;
- analysis methods.
Heterogeneity should be explored, not merely tested.
When to use meta-analysis
Use meta-analysis when:
- studies address a coherent question;
- effect measures are compatible;
- outcome definitions are sufficiently comparable;
- bias and design differences are evaluated;
- pooling has a clear interpretive target.
Do not pool merely because studies report numerical results.
Research question and variables
For study :
Fixed-effect model:
Random-effects model:
The random-effects weight is:
Data structure
Study-level meta-analysis data
simulated data| Variable | Meaning |
|---|---|
study | Study label |
yi | Effect estimate |
sei | Standard error |
vi | Sampling variance |
| Design fields | Population, intervention and risk of bias |
Statistical assumptions
Fixed versus random effects
Fixed effect assumes one common true effect.
Random effects allow a distribution of true effects.
Random effects do not solve unexplained heterogeneity.
They usually give relatively more weight to smaller studies.
Heterogeneity statistics
Cochran’s Q assesses whether observed variation exceeds sampling error.
is:
is the estimated between-study variance in effect units squared.
depends on study precision and should not be interpreted as an absolute clinical measure.
Worked example
Worked analysis in R
meta_data <- read.csv(
  "data/part-16-meta-analysis-data.csv"
)

library(metafor)

meta_data$vi <- meta_data$sei^2

random_fit <- rma(
  yi = yi,
  vi = vi,
  data = meta_data,
  method = "REML"
)

random_fit

forest(
  random_fit,
  slab = meta_data$study,
  xlab = "Mean difference"
)

predict(
  random_fit,
  digits = 3
)
Selected analysis output
REML random-effects pooled estimate ≈ -0.28 (95% CI -0.40 to -0.16)
Heterogeneity is modest in the simulated studies.
Visualising the synthesis
Prediction intervals
A confidence interval describes uncertainty in the mean pooled effect.
A prediction interval describes the range of true effects expected in a new comparable study.
With few studies, prediction intervals are uncertain.
Small-study effects
Funnel plots and regression tests can identify asymmetry.
Asymmetry can arise from:
- publication bias;
- heterogeneity;
- poor methods;
- chance;
- outcome reporting.
Do not diagnose publication bias from one plot alone.
Interpreting the output
Presenting the analysis
Suggested reporting
Use PRISMA 2020 for the review [1].
Report model, effect measure, variance estimator, heterogeneity, prediction interval, risk of bias and sensitivity analyses [2], [3].
General principles for fixed- and random-effects synthesis, heterogeneity and forest-plot interpretation are developed by Borenstein and colleagues [4].
Common mistakes
Knowledge check
What does tau-squared measure?
Answer and reasoning
Estimated between-study variance in true effects.
How does a prediction interval differ from a confidence interval?
Answer and reasoning
It describes potential true effects in a new study rather than uncertainty in the mean effect.
Does random effects remove heterogeneity?
Answer and reasoning
No. It models it.
Why inspect risk of bias?
Answer and reasoning
A precise pooled estimate can be systematically wrong if contributing studies are biased.
What does a forest plot show?
Answer and reasoning
Individual effects and CIs, study weights and the pooled estimate.
Key take-home messages
References
- Page MJ, McKenzie JE, Bossuyt PM, Boutron I, Hoffmann TC, Mulrow CD, et al. PRISMA 2020 statement. BMJ. 2021;372:n71. https://doi.org/10.1136/bmj.n71
- DerSimonian R, Laird N. Meta-analysis in clinical trials. Control Clin Trials. 1986;7(3):177–188. https://doi.org/10.1016/0197-2456(86)90046-2
- Viechtbauer W. Conducting meta-analyses in R with metafor. J Stat Softw. 2010;36(3):1–48. https://doi.org/10.18637/jss.v036.i03
- Borenstein M, Hedges LV, Higgins JPT, Rothstein HR. Introduction to meta-analysis. Chichester: Wiley; 2009.
These notes support learning and research planning and do not replace statistical consultation for a specific study.