
Part 16 · Module 10
Handling High-Dimensional Medical Data
Learn how regularisation, dimension reduction, multiplicity control and nested validation address medical datasets with many predictors relative to participants.
Learning outcomes
After completing this lecture, you should be able to:
- Define high-dimensional data and p greater than n settings.
- Explain regularisation and sparsity.
- Distinguish prediction from biomarker discovery.
- Use nested cross-validation and stability assessment.
- Recognise batch effects and preprocessing leakage.
- Use R code for lasso feature selection.
Overview
High-dimensional data contain many candidate variables relative to the number of independent participants.
Examples include:
- genomics;
- proteomics;
- imaging radiomics;
- metabolomics;
- electronic health-record features;
- wearable time series.
Ordinary unpenalised regression can become unstable or unidentified.
Why this matters
When is large:
- many chance associations occur;
- variable selection is unstable;
- overfitting is severe;
- apparent performance is optimistic;
- batch effects can dominate biology.
The analysis plan must distinguish:
- prediction;
- association discovery;
- causal estimation;
- dimension reduction.
When to use specialised methods
Use regularised or dimension-reduction methods when ordinary modelling cannot support the candidate complexity.
The number of independent participants, not rows or features, drives information.
Research question and variables
The lasso solves:
controls shrinkage.
Larger sets more coefficients to zero.
Data structure
High-dimensional prediction data
simulated data| Component | Value |
|---|---|
| Participants | 800 |
| Candidate predictors | 30 |
| True signal predictors | 5 |
| Outcome | Binary |
Real omics datasets may contain tens of thousands of variables.
Statistical assumptions
Regularisation
Ridge
Uses squared-coefficient penalty.
Retains correlated predictors with shrinkage.
Lasso
Uses absolute-value penalty.
Produces sparse models but may select one of several correlated predictors arbitrarily.
Elastic net
Combines ridge and lasso.
Often useful for correlated biological features.
Worked example
Worked analysis in R
high_dimensional <- read.csv(
  "data/part-16-high-dimensional-data.csv"
)

x_names <- paste0(
  "x",
  1:30
)

x <- as.matrix(
  high_dimensional[
    x_names
  ]
)

y <- high_dimensional$outcome

set.seed(20260806)

lasso_fit <- glmnet::cv.glmnet(
  x,
  y,
  family = "binomial",
  alpha = 1,
  nfolds = 10
)

coef(
  lasso_fit,
  s = "lambda.min"
)

plot(
  lasso_fit
)
Selected analysis output
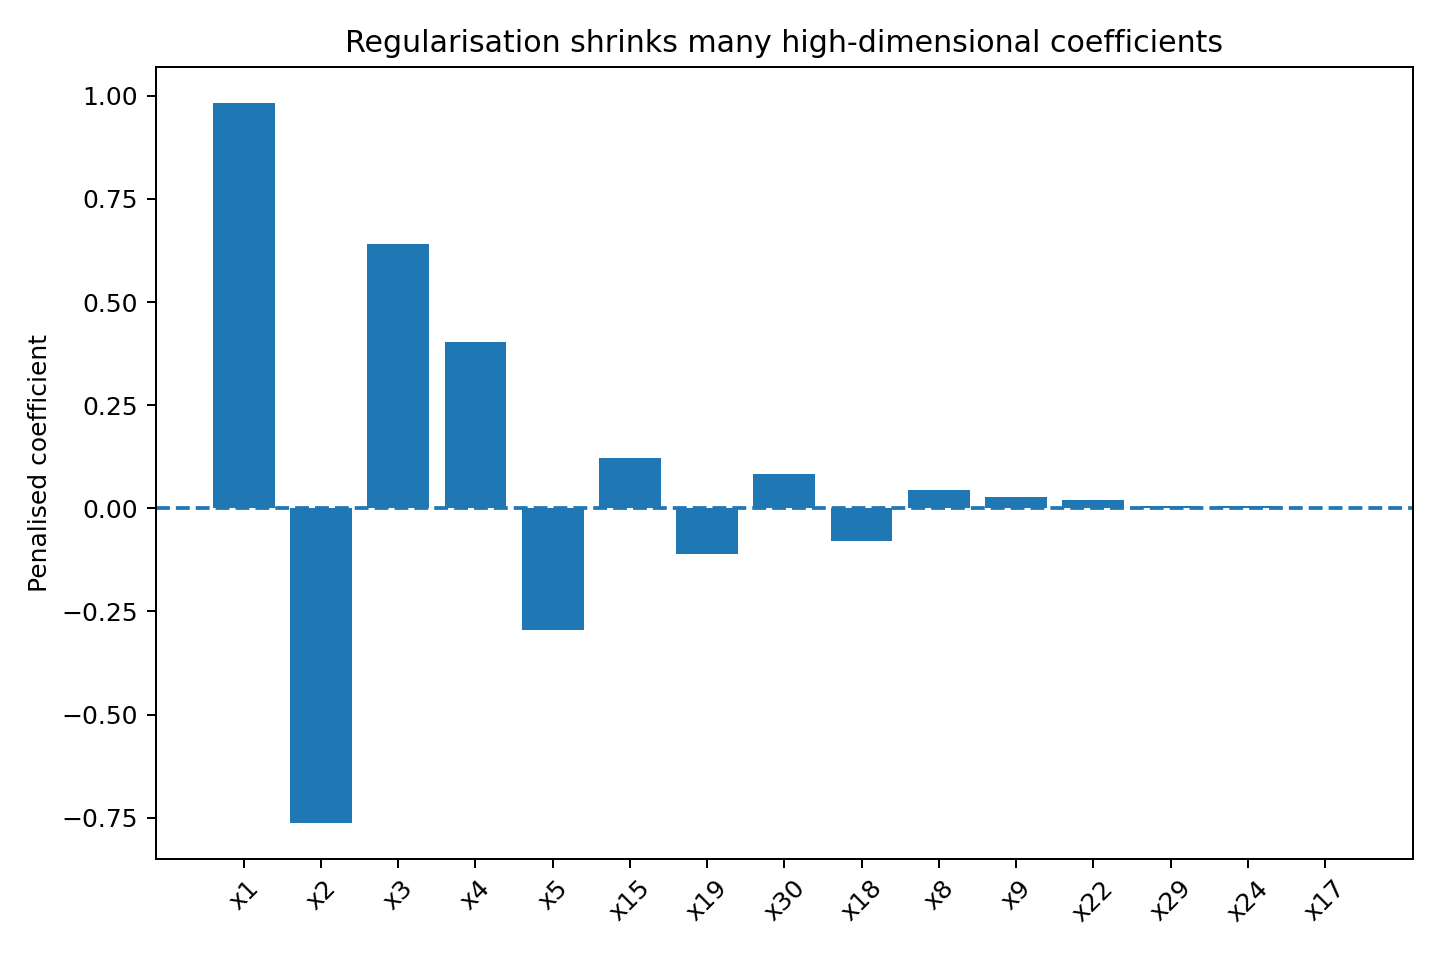
The lasso retains a subset of non-zero coefficients.

Several noise features can be selected because of finite-sample correlation.
Visualising penalised coefficients
Dimension reduction
Methods include:
- principal component analysis;
- partial least squares;
- autoencoders;
- supervised components.
Unsupervised components maximise predictor variation, not outcome relevance.
Components can be difficult to interpret and transport.
Multiple testing
For biomarker discovery, control:
- family-wise error;
- false discovery rate.
A predictive lasso model and a differential-expression analysis answer different questions.
Nested validation
Tuning and feature selection must occur inside each training fold.
Outer folds estimate performance.
A single cross-validation loop used both for tuning and reporting is optimistic.
Batch effects
Laboratory batch, scanner and site can create strong artificial patterns.
Batch correction must avoid using test-set outcomes or future information.
External validation across sites is essential.
Interpreting the output
Presenting the analysis
Suggested reporting
Report participant count, feature count, preprocessing, batch handling, penalty, tuning, resampling unit, stability, multiplicity and external validation.
Lasso estimation, coordinate-descent implementation, microarray-analysis pitfalls and sparse-learning theory are described in foundational sources [1], [2], [3], [4].
Common mistakes
Knowledge check
What does lasso penalise?
Answer and reasoning
The sum of absolute coefficient values.
Why can correlated features be unstable?
Answer and reasoning
Small sample changes can make lasso select different members of a correlated group.
What is nested cross-validation?
Answer and reasoning
An outer loop estimates performance while inner loops tune the model.
Does PCA select outcome-relevant components?
Answer and reasoning
Not necessarily; it maximises predictor variance.
What is a batch effect?
Answer and reasoning
Systematic technical variation associated with processing, scanner, laboratory or site.
Key take-home messages
References
- Tibshirani R. Regression shrinkage and selection via the lasso. J R Stat Soc Series B. 1996;58(1):267–288.
- Friedman J, Hastie T, Tibshirani R. Regularization paths for generalized linear models via coordinate descent. J Stat Softw. 2010;33(1):1–22. https://doi.org/10.18637/jss.v033.i01
- Simon R, Radmacher MD, Dobbin K, McShane LM. Pitfalls in the use of DNA microarray data. J Natl Cancer Inst. 2003;95(1):14–18. https://doi.org/10.1093/jnci/95.1.14
- Hastie T, Tibshirani R, Wainwright M. Statistical learning with sparsity. Boca Raton: CRC Press; 2015.
These notes support learning and research planning and do not replace statistical consultation for a specific study.