
Part 13 · Module 2
Baseline Characteristics in Clinical Trials
Learn how to present baseline characteristics descriptively, avoid inappropriate significance testing and use prespecified covariate adjustment.
Learning outcomes
After completing this lecture, you should be able to:
- Explain the purpose of a trial baseline table.
- Describe numerical and categorical baseline variables appropriately.
- Explain why baseline significance tests are unnecessary after randomisation.
- Use standardised differences as descriptive diagnostics.
- Distinguish chance imbalance from allocation failure.
- Plan efficient prespecified covariate adjustment.
Overview
A baseline table describes who entered a trial and supports assessment of applicability, data quality and randomisation implementation.
It is not primarily a hypothesis-testing table.
Randomisation permits chance imbalance. A small baseline p-value does not prove failed randomisation, and a large one does not prove correct allocation.
CONSORT recommends reporting baseline demographic and clinical characteristics by randomised group without significance testing [1].
Why this matters
Baseline tests answer a question that is already known to be governed by random allocation.
They also depend strongly on sample size:
- small trials may have clinically important imbalances with large p-values;
- large trials may show tiny imbalances with small p-values.
The analysis should not add or remove covariates solely because baseline p crosses 0.05.
When to use this framework
Use this framework for parallel, factorial, cluster and crossover trials.
In cluster trials, describe both cluster-level and participant-level characteristics.
In crossover trials, describe participants by sequence rather than period treatment alone.
Research question and variables
A useful baseline table reports:
- group counts;
- age and sex;
- disease severity;
- baseline outcome;
- stratification variables;
- important prognostic factors;
- missing values.
Variables should be selected before inspecting group differences.
Data structure
Suggested baseline-table structure
simulated data| Characteristic | Control | Intervention |
|---|---|---|
| Participants | 120 | 120 |
| Age, mean (SD), years | Reported | Reported |
Female, n/N (%) | Reported | Reported |
| Baseline outcome, mean (SD) | Reported | Reported |
Site, n (%) | Reported | Reported |
Statistical assumptions
Descriptive summaries
Use:
- mean and SD for clinically meaningful numerical summaries;
- median and quartiles for markedly skewed variables;
- counts and percentages for categories;
- variable-specific denominators when missing.
Avoid reporting SE at baseline because the table describes participants rather than estimating a population mean as its primary purpose.
Standardised mean differences
For a numerical variable:
For a binary variable, use a pooled binomial variance.
SMDs are descriptive diagnostics, not tests.
Thresholds such as 0.1 are rough guides rather than universal decision rules.
Worked example
Worked analysis in R
trial <- read.csv(
  "data/part-13-trial-data.csv"
)

standardised_mean_difference <- function(
  x,
  group
) {
  x1 <- x[group == 1]
  x0 <- x[group == 0]

  (
    mean(x1) - mean(x0)
  ) / sqrt(
    (
      var(x1) + var(x0)
    ) / 2
  )
}

c(
  age = standardised_mean_difference(
    trial$age,
    trial$group
  ),
  baseline = standardised_mean_difference(
    trial$baseline,
    trial$group
  )
)

aggregate(
  cbind(
    age,
    baseline
  ) ~ group_label,
  data = trial,
  FUN = function(x) {
    c(
      mean = mean(x),
      sd = sd(x)
    )
  }
)

with(
  trial,
  table(group_label, site)
)
Selected analysis output
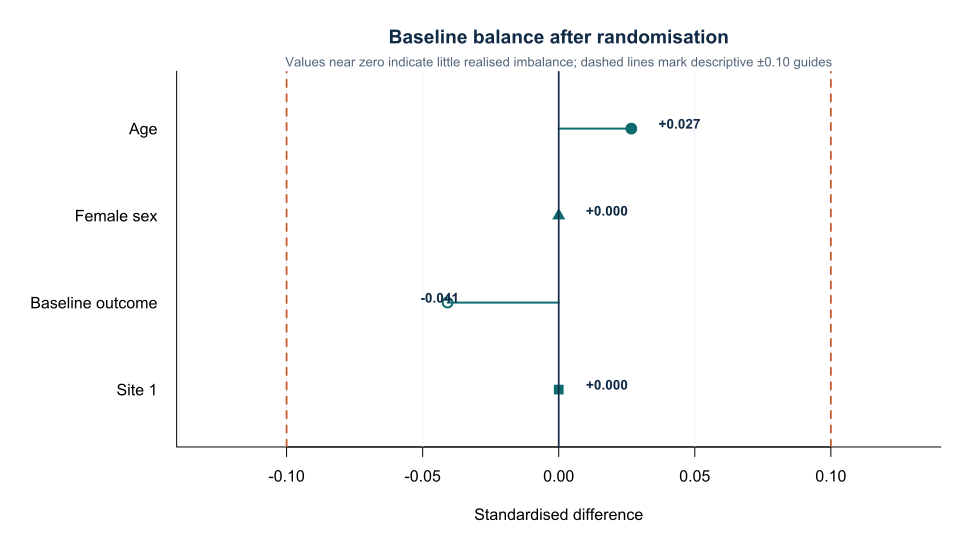
Age SMD = 0.027
Female SMD = 0.000
Baseline outcome SMD = -0.041
Site 1 SMD = 0.000
(The standardised-difference calculations for female sex and Site 1 are not shown here.)
Visualising baseline characteristics
Covariate adjustment
Prespecified adjustment for strong baseline prognostic variables can improve precision.
Common examples include:
- baseline value of the outcome;
- randomisation strata;
- site;
- key prognostic factors.
Adjustment is justified by prognosis and design, not by observed imbalance.
For continuous outcomes, ANCOVA is generally preferable to analysing change scores alone when baseline is strongly related to follow-up.
Suspicious imbalance
A pattern can justify investigation when:
- allocation counts conflict with the randomisation list;
- site or time patterns are implausible;
- enrolment changes before known assignments;
- exclusions occur after allocation.
The response is to audit trial conduct, not to repair randomisation using baseline p-values.
Interpreting the table
Presenting the results
Suggested reporting
Report group-specific values, missing denominators and relevant cluster characteristics.
CONSORT 2025 retains baseline descriptive reporting and discourages tests of baseline differences [1].
The rationale against routine baseline testing, the use of standardised balance diagnostics and prespecified baseline covariate adjustment are developed in methodological guidance [2], [3], [4].
Common mistakes
Knowledge check
What is the main purpose of the baseline table?
Answer and reasoning
To describe the realised trial population and support assessment of applicability and data quality.
Why are baseline p-values unnecessary?
Answer and reasoning
Random allocation generated the differences; testing them does not validate randomisation.
Should covariates be adjusted only when imbalanced?
Answer and reasoning
No. Prespecify adjustment using prognosis and design.
What does an SMD near zero show?
Answer and reasoning
Little observed difference on that measured variable in standardised units.
What should suspicious imbalance trigger?
Answer and reasoning
An audit of allocation and enrolment procedures.
Key take-home messages
References
- Hopewell S, Chan AW, Collins GS, Hróbjartsson A, Moher D, Schulz KF, et al. CONSORT 2025 statement. BMJ. 2025;389:e081123. https://doi.org/10.1136/bmj-2024-081123
- Senn S. Testing for baseline balance in clinical trials. Stat Med. 1994;13(17):1715–1726. https://doi.org/10.1002/sim.4780131703
- Austin PC. Balance diagnostics for comparing the distribution of baseline covariates. Stat Med. 2009;28(25):3083–3107. https://doi.org/10.1002/sim.3697
- European Medicines Agency. Guideline on adjustment for baseline covariates in clinical trials. London: EMA; 2015.
These notes support learning and research planning and do not replace statistical consultation for a specific study.