
Part 16 · Module 14
Analysis of Complex Survey Data
Learn how sampling weights, strata, clusters and finite-population design determine estimation and uncertainty in complex health surveys.
Learning outcomes
After completing this lecture, you should be able to:
- Explain unequal selection probabilities and survey weights.
- Distinguish strata, primary sampling units and stages.
- Calculate weighted prevalence and design-based variance.
- Explain design effect and effective sample size.
- Recognise lonely-PSU and non-response adjustments.
- Use R code with the survey package.
Overview
Complex surveys often use:
- stratification;
- clustering;
- unequal selection probabilities;
- multistage sampling;
- non-response adjustment;
- calibration.
Ordinary unweighted analyses can produce biased population estimates and incorrect standard errors.
Why this matters
A survey sample may deliberately oversample:
- rural areas;
- minority populations;
- high-risk groups;
- small regions.
Each participant represents a different number of population members.
Clustering reduces independent information, while stratification can improve precision.
When to use survey methods
Use design-based survey analysis when data arise from a probability sample with weights, strata or clusters.
Examples include national health surveys, school surveys and household surveys.
Administrative databases and convenience samples are not made representative merely by assigning arbitrary weights.
Research question and variables
A Horvitz–Thompson weighted mean is:
where:
and is the inclusion probability.
Data structure
Complex-survey variables
simulated data| Variable | Meaning |
|---|---|
stratum | Sampling stratum |
cluster | Primary sampling unit |
weight | Final survey weight |
outcome | Binary health outcome |
| Finite population | Optional stratum or PSU totals |
Statistical assumptions
Sampling weights
Base weights are inverse selection probabilities.
Final weights may also include:
- non-response adjustment;
- post-stratification;
- raking;
- calibration;
- trimming.
Weight variation can increase variance.
Stratification and clustering
Stratification can improve precision when strata are internally homogeneous.
Clustering often reduces precision because participants within a PSU are similar.
The net design effect depends on both.
Worked example
Worked analysis in R
survey_data <- read.csv(
  "data/part-16-complex-survey-data.csv"
)

library(survey)

survey_design <- svydesign(
  ids = ~cluster,
  strata = ~stratum,
  weights = ~weight,
  data = survey_data,
  nest = TRUE
)

unweighted_prevalence <- mean(
  survey_data$outcome
)

weighted_prevalence <- svymean(
  ~outcome,
  design = survey_design
)

unweighted_prevalence
weighted_prevalence

svyby(
  ~outcome,
  ~stratum,
  survey_design,
  svymean
)

svyglm(
  outcome ~ stratum,
  design = survey_design,
  family = quasibinomial
)
Selected analysis output
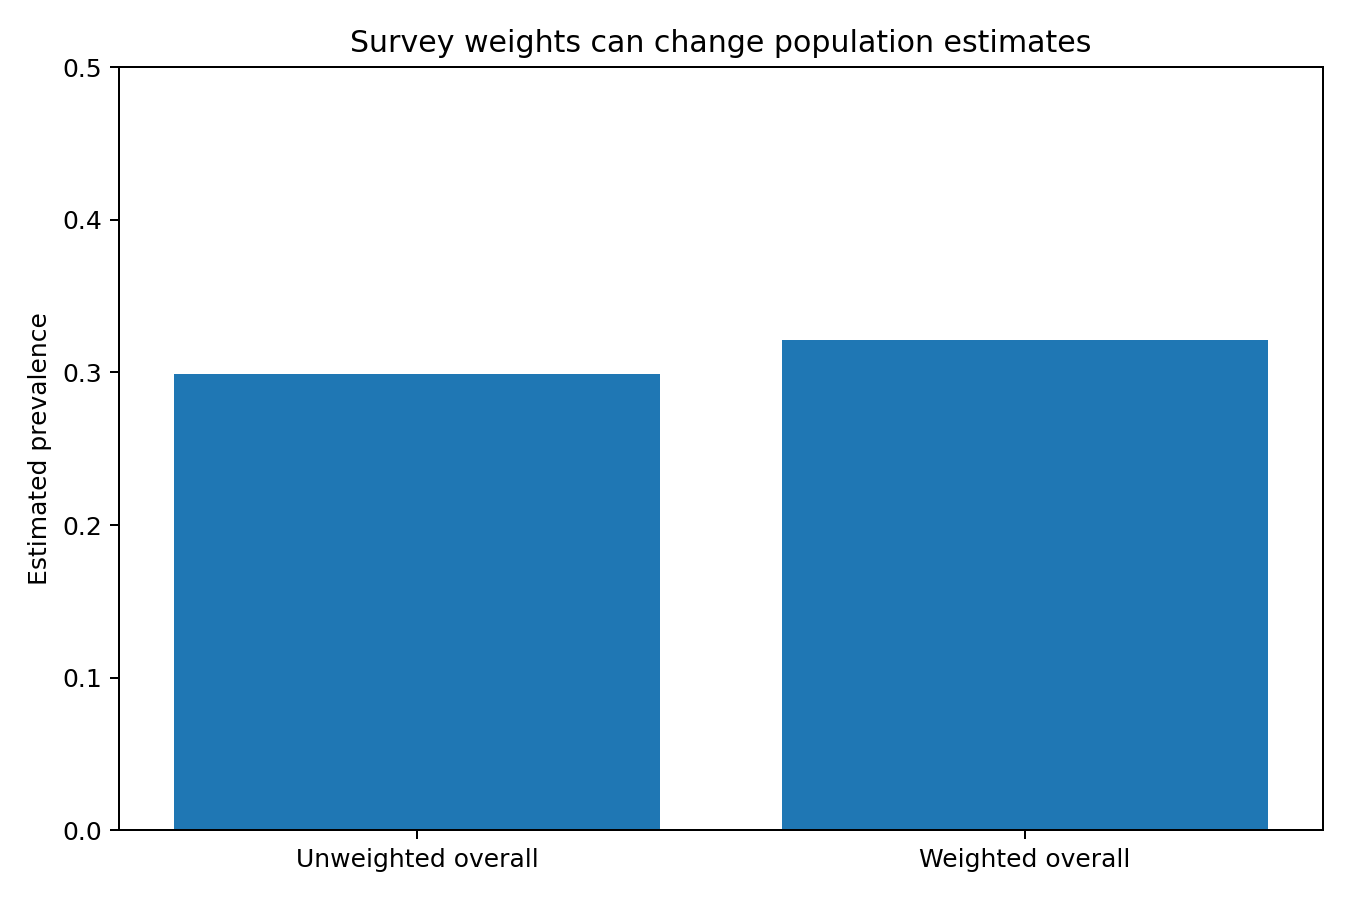
The weighted overall prevalence exceeds the unweighted estimate because rural participants have larger survey weights.Visualising weighting effects
Design effect
The design effect is:
Effective sample size is sometimes approximated by:
It varies by outcome and estimator.
Domain analysis
Subpopulation analysis should retain the complete survey design.
Do not simply delete all participants outside the domain before constructing the design, because PSU and stratum information can be lost.
Use subset() on the survey design.
Lonely PSUs
A stratum with one sampled PSU cannot estimate within-stratum variance conventionally.
Options include:
- certainty-PSU treatment;
- averaging;
- collapsing strata;
- design-specific adjustments.
The solution should reflect the sampling design.
Replicate weights
Some surveys provide:
- bootstrap weights;
- jackknife weights;
- balanced repeated replication weights.
Use the supplied replication method rather than reconstructing a simplified design when possible.
Interpreting the output
Presenting the analysis
Suggested reporting
Report population, frame, stages, response rates, weight construction, trimming, calibration, strata, PSUs, variance method, finite-population corrections and design effects [1], [2].
Applied survey-analysis texts provide further guidance on multistage designs, weighting and health-survey inference [3], [4].
Common mistakes
Knowledge check
What does a base weight represent?
Answer and reasoning
The inverse probability of selection.
Why can clustering increase variance?
Answer and reasoning
Participants within a PSU tend to be similar, reducing independent information.
Why retain full design for domains?
Answer and reasoning
The variance estimator needs complete stratum and PSU information.
What is a design effect?
Answer and reasoning
The variance ratio comparing the complex design with simple random sampling.
What should accompany weighted estimates?
Answer and reasoning
Design-based SEs or confidence intervals and unweighted sample counts.
Key take-home messages
References
- Lumley T. Analysis of complex survey samples. J Stat Softw. 2004;9(1):1–19. https://doi.org/10.18637/jss.v009.i08
- Lumley T. Complex surveys: a guide to analysis using R. Hoboken: Wiley; 2010.
- Heeringa SG, West BT, Berglund PA. Applied survey data analysis. 2nd ed. Boca Raton: CRC Press; 2017.
- Korn EL, Graubard BI. Analysis of health surveys. New York: Wiley; 1999.
These notes support learning and research planning and do not replace statistical consultation for a specific study.