
Part 10 · Module 9
Clinical Utility and Impact of Prediction Models
Learn how to move beyond predictive accuracy to decision thresholds, net benefit, workflow integration, impact studies and evidence that model use improves care.
Learning outcomes
After completing this lecture, you should be able to:
- Distinguish statistical prediction performance from clinical utility and patient benefit.
- Explain how decision thresholds connect predicted risk to clinical actions and consequences.
- Interpret the purpose of decision-curve analysis and net benefit without treating it as an impact trial.
- Plan implementation and impact studies that evaluate workflow, uptake, safety, equity and patient outcomes.
- Design governance and monitoring for model use, including versioning, drift and post-implementation performance.
Overview
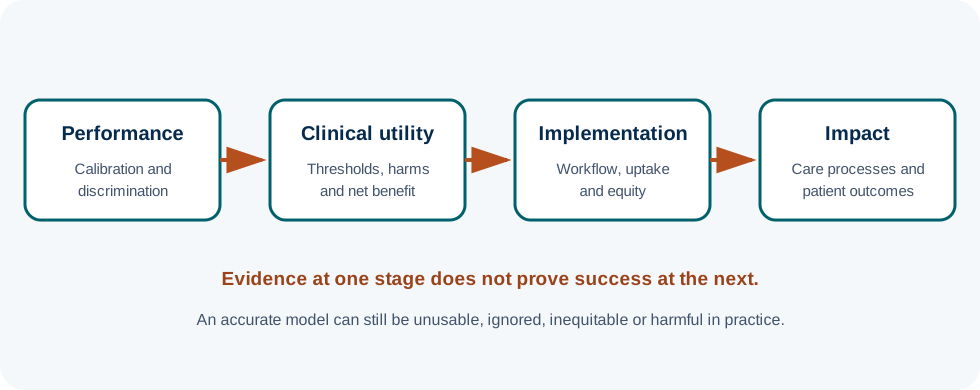
A prediction model can be well calibrated, discriminate strongly and validate externally yet still fail to improve care. Clinical utility asks whether predictions support better decisions given the consequences of acting and not acting. Impact asks what happens when the model is actually introduced into a clinical workflow.[1,2]
These are different evidence stages. Decision-analytic methods such as decision-curve analysis can estimate whether using a model has greater expected net benefit than simple alternatives across plausible decision thresholds.[3] They do not show that clinicians will use the model correctly, that treatment will be delivered, or that patient outcomes will improve. Those questions require implementation and comparative impact evaluation.
This final Part 10 lecture completes the pathway from model development and validation to responsible clinical use.
Why this matters
Prediction research often stops too early. Publications celebrate an area under the curve or a statistically significant improvement in discrimination, but the proposed decision is never specified. Without a decision threshold, the clinical meaning of false positives and false negatives remains vague.
Implementation can also introduce new failures. Alerts may be ignored, clinicians may override predictions selectively, high-risk labels may trigger unavailable services, and performance can drift as populations or practices change. The model becomes part of a sociotechnical intervention rather than a detached equation.
Key concepts
Decision threshold
A threshold probability is the risk at which the expected benefit of intervention is judged sufficient to justify its burdens or harms. It represents a trade-off between false-positive and false-negative decisions.[3]
Thresholds should arise from clinical consequences, patient preferences, intervention effectiveness and resources—not from selecting the mathematically best point on a receiver-operating-characteristic curve.
Clinical utility
Clinical utility concerns whether using predictions to guide action is expected to improve decision quality compared with relevant alternatives such as treat all, treat none, clinician judgement or an existing score.
Clinical impact
Impact is observed change after implementation: treatment allocation, test ordering, clinician behaviour, patient outcomes, harms, resource use, workflow burden or equity.
From performance to decision consequences
A model with excellent discrimination can still be clinically useless if all patients would receive the same treatment regardless of risk, or if predicted risks are badly calibrated near the treatment threshold. Conversely, a modestly discriminating model can be useful if it improves targeting of an effective but burdensome intervention.
Questions before claiming clinical utility
- What specific decision will the prediction change?
- What are the plausible risk thresholds for that decision?
- What are the consequences of false-positive and false-negative actions?
- What comparator strategy reflects current practice?
- Is the model calibrated in the intended setting, especially near relevant thresholds?
- Is the downstream intervention effective and available?
- Can the prediction be delivered in time and in a form clinicians and patients can use?
Decision-curve analysis and net benefit
Decision-curve analysis compares strategies across threshold probabilities. Net benefit places true-positive and false-positive decisions on a common scale using the threshold probability to weight their relative consequences.[3]
The usual comparators include:
- treat none: no participant receives the intervention;
- treat all: every participant receives the intervention; and
- model-guided strategy: intervention is offered when predicted risk exceeds the threshold.
A model has potential decision value at a threshold when its net benefit exceeds clinically relevant alternatives. However, net benefit depends on calibrated risk predictions and the meaning of the threshold.
Decision curves do not choose the threshold for youMMed extension
The x-axis threshold encodes values and consequences. A decision curve shows how strategies compare across thresholds, but researchers still need to justify which threshold range is plausible for the intended intervention. Reporting the threshold that makes the model look best without clinical justification recreates data-driven optimisation at the decision stage.
Why classification accuracy is insufficient
Measures such as sensitivity and specificity at a threshold describe classification but do not directly incorporate the relative value of true and false decisions. Overall percentage correctly classified is particularly problematic when outcomes are uncommon because a strategy can appear highly accurate by predicting the majority outcome for everyone.
Clinical utility requires connecting performance to action. The relevant quantity may include avoided unnecessary procedures, appropriately targeted treatment, delayed diagnoses, complications, quality-adjusted life-years or other decision consequences.
Preparing for implementation
Prediction-model implementation study
Core structure: A validated model is embedded in a defined workflow with specified users, timing, thresholds, actions and governance; process and clinical outcomes are then evaluated.
Best suited for: Determining whether model-guided care changes decisions, care delivery or patient outcomes in real practice.
Important limitations: Contamination, clinician adaptation, alert fatigue, variable intervention uptake, system changes, equity effects and temporal performance drift.
Implementation should specify:
- Trigger: When is the prediction calculated?
- User: Clinician, patient, multidisciplinary team or automated pathway?
- Display: Probability, risk category, explanation and uncertainty?
- Threshold: What action is recommended at each level?
- Action: What service, test or treatment follows?
- Override: Can users deviate, and is the reason recorded?
- Feedback: How are errors, drift and unexpected effects detected?
Illustrative model-to-action pathway
illustrativeTable 1. Operationalising the postpartum risk model
| Element | Illustrative specification |
|---|---|
| Prediction moment | 12-week postpartum assessment |
| User | Diabetes prevention nurse and clinician |
| Output | Five-year absolute risk with model version |
| Threshold | Prespecified after stakeholder and resource review |
| Action | Offer intensive prevention programme |
| Comparator | Existing follow-up strategy |
| Monitoring | Uptake, overrides, calibration, outcomes, workload, equity |
Impact-study designs
Individual randomised trial
Participants can be randomised to model-guided care versus usual care when the intervention can be assigned individually without major contamination.
Cluster-randomised trial
Clinics or practices can be randomised when clinicians would find it difficult to use the model for some patients but not others, or when workflow changes occur at service level. The analysis must account for clustering.
Stepped-wedge design
Sites cross from control to implementation over time. This can be attractive for staged rollout but is vulnerable to secular trends and requires careful timing and analysis.
Quasi-experimental evaluation
Interrupted time-series or controlled before-and-after designs can evaluate real-world implementation when randomisation is infeasible, but concurrent changes and temporal confounding require explicit design control.
Impact-study elements to prespecify
- Eligible population and implementation setting.
- Model version and locked prediction algorithm.
- Decision threshold and model-triggered action.
- Comparator strategy and contamination prevention.
- Primary patient-important or clinically meaningful outcome.
- Process outcomes such as risk calculation, alert delivery, clinician response and intervention uptake.
- Harms, workload, resource use and equity outcomes.
- Follow-up period and handling of cluster or secular effects.
- Monitoring for calibration drift and software failures during the study.
Choosing outcomes
An impact study should measure the mechanism as well as the endpoint. If the model does not improve patient outcomes, investigators need to know whether the prediction was inaccurate, the alert was not seen, clinicians did not act, patients declined the intervention, or the intervention itself was ineffective.
A logic chain might be:
prediction generated → displayed → understood → action changed → intervention received → biological or behavioural effect → patient outcome.
Measuring these intermediate steps strengthens interpretation.
Bias and implementation threats
Other threats include contamination between trial arms, selective model use, missing overrides, changes to the model during evaluation, outcome ascertainment influenced by risk labels, and post-implementation changes in who attends the service.
Appraising claims of prediction-model impact
- Was the model externally validated before implementation?
- Is the decision threshold clinically justified and prespecified?
- Is the comparator a credible representation of current practice?
- Does the design support attribution of outcome differences to model-guided care?
- Were both intended actions and actual clinician/patient responses measured?
- Were harms, workload, equity and resource consequences captured?
- Was model performance monitored during implementation?
- Were model version changes prevented or explicitly analysed?
Equity, fairness and distributional consequences
A model can have similar overall performance while producing different errors across groups. But subgroup performance estimates can also be unstable when sample sizes are small. Evaluation should therefore combine quantitative subgroup assessment with examination of access, measurement, workflow and consequences.
Fairness is not achieved solely by forcing one accuracy metric to be identical across groups. The appropriate concern depends on the clinical decision, baseline risk, consequences of errors and structural access to the intervention. Implementation should monitor who receives predictions, who crosses thresholds, who receives the recommended action and who benefits or is harmed.
Ethics and governance
Patients may also need understandable information about how risk estimates influence care. Transparency requirements vary with context, but clinicians should know the model’s intended population, limitations, threshold logic and what to do when clinical judgement conflicts with the prediction.
Post-implementation monitoring
Performance can drift because the population, measurement systems, treatments or coding practices change. Monitoring should include:
- predictor distributions and missingness;
- calibration and discrimination at reasonable intervals;
- rates of high-risk classification;
- clinician overrides;
- intervention uptake;
- patient-important outcomes and harms;
- subgroup and equity indicators; and
- technical incidents or changes in software dependencies.
Monitoring plans should specify actions when performance deteriorates: investigation, recalibration, temporary suspension or formal model update.
Interface with statistical analysis
Decision-curve analysis is a statistical decision-support evaluation, not a substitute for an impact study.[3] Comparative implementation studies require methods appropriate to their design: individual trials, cluster trials, stepped-wedge designs or interrupted time series. Absolute risk differences and confidence intervals are often more interpretable for impact than relative measures alone.
For cluster designs, account for intracluster correlation. For time-to-event outcomes, define time zero and follow-up consistently. Cost-effectiveness analysis can extend impact evaluation when resource allocation is central.
Defining the clinical decision precisely
A risk threshold makes sense only in relation to an action. “High risk” is not a clinical endpoint. The protocol should specify who receives what action, when, for how long, and what happens when the prediction is unavailable. If several actions exist—routine follow-up, enhanced counselling, medication, specialist referral—different thresholds may be needed.
Thresholds can also differ between patients because preferences and contraindications differ. A model can support shared decision-making by presenting absolute risk across a range, rather than forcing one universal category. Impact evaluation should record how recommendations are modified by preferences and clinical judgement.
Net benefit and absolute consequences
Net benefit is useful because it expresses trade-offs on a common scale, but stakeholders may also need more concrete quantities: additional true-positive interventions per 1000 patients, unnecessary interventions avoided, missed events, number referred and expected complications. Presenting these alongside decision curves can make the implications of a threshold understandable.
A high net benefit at a threshold does not imply that every model-guided action is beneficial. It is an expected population-level comparison under assumptions about the relative value of true- and false-positive decisions. Those assumptions should align with the downstream intervention.
Human factors and workflow fidelity
Clinical decision support can fail because the output arrives too late, interrupts workflow, is difficult to interpret or lacks a clear action. Before a definitive impact trial, usability testing can examine whether clinicians understand the probability, whether the threshold is visible, and whether recommended actions can be completed within existing systems.
Alert fatigue is a predictable harm when a model triggers frequently. Monitoring should include alert volume, acknowledgement, overrides and time burden. A model that increases documentation without changing care may have negative utility even if prediction itself is accurate.
Contamination and behavioural adaptation
Clinicians exposed to a prediction tool may change practice for control patients, particularly in individual-randomised studies within one clinic. Cluster randomisation can reduce this contamination but introduces cluster-level confounding and requires more clusters for reliable inference. Stepped-wedge designs ensure eventual rollout but are particularly sensitive to secular trends and learning over time.
Behaviour may also change during an impact study. Clinicians can learn which patients are often labelled high risk and begin approximating the model without consulting it. Measuring model access and clinician response helps interpret dilution of the intervention contrast.
Safety and unintended consequences
Impact evaluation should actively seek harms: delayed care from low-risk labels, unnecessary tests from high-risk labels, anxiety, inequitable referral, intervention complications and resource displacement. A model can improve one endpoint while worsening another. Predefine safety outcomes and stopping or review procedures when the intervention can cause substantial harm.
Monitoring after the impact study
A positive impact trial does not make monitoring unnecessary. Once use broadens, case mix can change and performance can drift. Real-world monitoring should preserve the model version, population denominator and link between predictions, decisions and outcomes. If recalibration or retraining occurs, the updated version should be evaluated before silent replacement.
Minimum post-implementation monitoring dataset
- Model version and timestamp for every prediction.
- Predictor completeness and distribution drift.
- Predicted risk and action threshold crossed.
- Recommendation delivered and user acknowledgement.
- Override or deviation and reason where feasible.
- Downstream intervention actually received.
- Patient outcome and important adverse events.
- Calibration and decision performance over time.
- Equity indicators across clinically relevant groups and access stages.
Implementation evidence should match the claim
If the claim is “the model improves risk stratification”, external validation and decision analysis may be sufficient. If the claim is “the model improves care”, evidence must show changed decisions or processes. If the claim is “the model improves patient outcomes”, a comparative impact design with patient outcomes is required. Aligning the strength of the claim with the evidence stage prevents overtranslation from statistical metrics to clinical benefit. Current reporting and risk-of-bias frameworks for prediction models provide complementary standards for describing the model evidence base that precedes impact evaluation.[4,5]
Choosing the primary impact estimand
The primary estimand should reflect the policy being implemented. In a cluster trial, this may be the effect of assigning a clinic to model-guided care, including imperfect clinician adherence. A per-protocol comparison among only those who followed recommendations answers a different, more confounded question. Prespecify both the implementation strategy and the analysis population so the reported effect matches the decision facing the health service.
Model availability is part of the intervention
Downtime, missing predictors or delayed computation can prevent a prediction from reaching the decision point. Impact studies should therefore report the proportion of eligible encounters in which a valid prediction was actually available. This implementation denominator distinguishes algorithm performance from system reliability and helps quantify the real exposure to model-guided care.
Clinical benefit requires an effective downstream action
Even perfect targeting cannot improve outcomes if the triggered intervention is ineffective, inaccessible or unacceptable. The model and the intervention should therefore be evaluated as one decision pathway.
Worked example
Testing model-guided postpartum prevention
The health system identifies a plausible risk threshold through evidence on prevention benefit, service capacity and stakeholder discussion rather than by maximising the model’s Youden index. Decision-curve analysis suggests that model-guided targeting has higher net benefit than offering intensive prevention to everyone or to no one across the plausible threshold range.
The team then designs a cluster-randomised trial in postpartum clinics. Intervention clinics receive the validated risk tool embedded in the electronic record with a prespecified action pathway. Control clinics continue existing follow-up. The model version is locked for the trial.
The primary outcome is a clinically meaningful measure at follow-up. Secondary outcomes include programme uptake, clinician overrides, participant adherence, adverse effects, workload, equity and model calibration. This design can determine whether using the model changes care and outcomes, rather than only whether its predictions are statistically accurate.
Suggested protocol or reporting wording
Common mistakes
Knowledge check
What does a threshold probability represent?
Answer and reasoning
It represents the risk level at which the expected benefit of acting is judged to balance the burden or harm of intervention, thereby encoding the relative consequences of false-positive and false-negative decisions.
Does higher net benefit on a decision curve prove that implementation improves patient outcomes?
Answer and reasoning
No. It suggests potential decision value under the specified threshold assumptions. Impact studies are needed to show that predictions are delivered, acted upon and translated into better outcomes in practice.
Why might cluster randomisation be preferable for an electronic risk tool?
Answer and reasoning
Clinicians may find it difficult to use the tool for selected patients while ignoring it for others, creating contamination. Randomising clinics can align the intervention with the level at which workflow changes occur.
Why should process outcomes be measured in an impact study?
Answer and reasoning
They reveal where the causal chain fails. If outcomes do not improve, process data can distinguish model inaccuracy from alert failure, clinician non-response, patient non-uptake or ineffective downstream intervention.
Why is post-implementation calibration monitoring necessary?
Answer and reasoning
Baseline risk, predictor distributions, care pathways and measurements can change over time. A previously calibrated model can therefore begin systematically over- or underpredicting risk, altering clinical decisions.
Key take-home messages
Key take-home messages
- Statistical prediction performance is necessary but not sufficient for clinical utility.
- Link predicted risks to explicit decisions, thresholds, comparators and consequences.
- Use decision analysis to estimate potential decision value and impact studies to test real-world benefit.
- Measure workflow, uptake, harms, resource use and equity as well as patient outcomes.
- Govern prediction models as evolving clinical interventions with versioning and performance monitoring.
References
- Kappen TH, van Klei WA, van Wolfswinkel L, Kalkman CJ, Vergouwe Y, Moons KGM. Evaluating the impact of prediction models: lessons learned, challenges, and recommendations. Diagn Progn Res. 2018;2:11. https://doi.org/10.1186/s41512-018-0033-6
- Reilly BM, Evans AT. Translating clinical research into clinical practice: impact of using prediction rules to make decisions. Ann Intern Med. 2006;144(3):201–209. https://doi.org/10.7326/0003-4819-144-3-200602070-00009
- Vickers AJ, Elkin EB. Decision curve analysis: a novel method for evaluating prediction models. Med Decis Making. 2006;26(6):565–574. https://doi.org/10.1177/0272989X06295361
- Collins GS, Moons KGM, Dhiman P, et al. TRIPOD+AI statement: updated guidance for reporting clinical prediction models that use regression or machine learning methods. BMJ. 2024;385:e078378. https://doi.org/10.1136/bmj-2023-078378
- Moons KGM, Damen JAA, Kaul T, et al. PROBAST+AI: an updated quality, risk of bias, and applicability assessment tool for prediction models using regression or artificial intelligence methods. BMJ. 2025;388:e082505. https://doi.org/10.1136/bmj-2024-082505
These materials support learning and research planning. They require adaptation to the study context and do not replace methodological, statistical, ethical, or regulatory consultation.