
Part 12 · Module 3
Explanatory Sequential Design
Use an initial quantitative phase to identify results that require explanation, then design a qualitative phase that explains those findings.
Learning outcomes
After completing this lecture, you should be able to:
- Explain the logic and sequence of an explanatory sequential mixed-methods design.
- Identify quantitative findings that justify targeted qualitative follow-up.
- Design connecting procedures that link phase-one results to phase-two sampling and data collection.
- Develop integrated interpretations that distinguish explanation from unsupported causal claims.
- Appraise common threats to validity, feasibility and transparency in explanatory sequential studies.
Overview
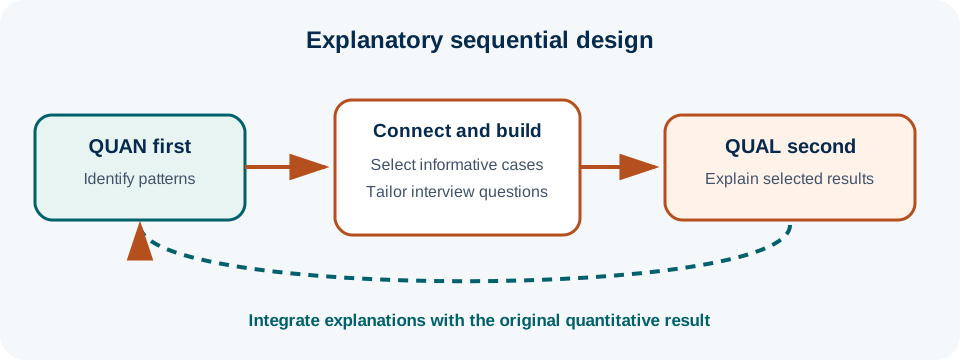
An explanatory sequential mixed-methods design begins with a quantitative phase and follows with a qualitative phase designed to explain, elaborate or contextualise selected quantitative findings.[1,2] The sequence is commonly represented as QUAN → qual, although the capitalisation is only a shorthand for relative priority and should not replace a substantive explanation of the design.
The defining feature is not simply that interviews occur after a survey. The qualitative phase must be connected to the quantitative results. Phase-one findings determine whom to sample, what questions to ask, which cases or subgroups deserve attention, or which unexpected patterns require explanation. Integration therefore occurs at the transition between phases and again when interpretations are brought together.[2]
This design is especially useful when a quantitative result is important but incomplete. A regression model may show that women living farther from a clinic are less likely to complete postpartum testing, yet distance itself does not explain how transport, childcare, work and service organisation combine in practice. A second qualitative phase can investigate the process behind the observed pattern while preserving appropriate caution about causality.
Why this matters
Quantitative analyses often produce findings that are statistically precise but substantively ambiguous. Researchers may identify a subgroup with unexpectedly poor outcomes, a counterintuitive association, heterogeneous intervention effects, or a result that differs from prior expectations. Without planned follow-up, the discussion section can become speculative.
Explanatory sequential design provides a disciplined alternative. Rather than guessing why a pattern occurred, researchers use the quantitative results to construct a targeted qualitative inquiry.[1] This can improve interpretation, reveal measurement limitations, identify mechanisms worth testing, and generate more useful service recommendations.
However, the design carries an important risk: the second phase can become a search for anecdotes that confirm the first phase. A credible study must allow qualitative findings to challenge, not merely support, the quantitative interpretation.
Key concepts
Sequence must have a reason
The order quantitative first, qualitative second is justified when the first phase creates an explanatory problem for the second phase. Ivankova and colleagues emphasised decisions about priority, sequence and points of integration in explanatory sequential studies.[1]
A weak sequence looks like this:
survey → interviews because interviews were planned anyway
A strong explanatory sequence looks like this:
quantitative analysis → identify result requiring explanation → select information-rich follow-up cases → tailor qualitative questions → qualitative analysis → integrated explanation
What counts as a result worth explaining?
Not every quantitative result needs qualitative follow-up. Priority should be given to findings that are important to the research question and for which context or mechanism could change interpretation or action. Examples include:
- an unexpected direction or magnitude of association;
- substantial variation between sites or subgroups;
- a clinically important but poorly understood pattern;
- discordance between an objective measure and patient-reported experience;
- an intervention effect accompanied by poor adherence or uneven uptake; or
- a null overall result that may conceal important implementation differences.
Selection should not be based only on statistical significance. A precisely estimated small association may be less important to explain than a clinically important subgroup pattern with wider uncertainty.
Connecting, building and integrating
Fetters and colleagues describe connecting as using results from one strand to guide sampling in another, and building as using one strand to shape the next strand’s data collection.[2] Explanatory sequential studies often use both.
For example, quantitative results may identify four participant profiles for qualitative sampling. The actual interview guide can then be built around the patterns needing explanation. Integration continues during interpretation through narrative weaving, joint displays or other explicit comparative structures.[3,4]
When to use this approach
Choose explanatory sequential design when the quantitative phase must come first
This design is appropriate when:
- the principal study question is primarily quantitative;
- quantitative results are expected to reveal patterns that require explanation;
- phase-two sampling or questioning cannot be specified adequately until phase-one results are known;
- the project has enough time for genuinely sequential work; and
- the research team can maintain rigour in both strands while planning explicit integration.
Use a convergent design instead when both strands can be designed independently and collected concurrently. Use exploratory sequential design when qualitative exploration is needed first to develop constructs, instruments or interventions for later quantitative study.
Research question and methodological fit
A strong explanatory sequential study contains three related questions:
- Quantitative question: What patterns, associations or effects are observed?
- Qualitative explanatory question: How do participants or stakeholders explain selected quantitative findings?
- Mixed-methods integration question: How do the qualitative explanations alter, elaborate or challenge interpretation of the quantitative results?
For the postpartum scenario:
Quantitative question: Which demographic, service and access characteristics are associated with postpartum glucose-test completion?
Qualitative question: How do women with contrasting testing outcomes and access profiles describe the processes that influenced whether testing was completed?
Integration question: How do women’s accounts explain or complicate the observed associations between age, travel distance, referral documentation and testing completion?
The wording matters. The qualitative phase should not be framed as proving the mechanism responsible for an association unless the overall design supports that causal inference.
The design should also be described in terms of its actual procedures rather than relying only on the label “explanatory sequential”. Mixed-methods design decisions include the relationship between questions, priority, timing and the point at which the two components interact.[5] This is especially important when a study contains more than two phases or when the qualitative phase starts before every quantitative analysis is complete.
Design, setting and study population
Explanatory sequential mixed-methods design
Core structure: Quantitative data collection and analysis are completed first. Selected results then guide a qualitative follow-up phase. Integrated interpretation occurs after the qualitative analysis.
Best suited for: Explaining unexpected findings, subgroup differences, implementation patterns, survey results, treatment heterogeneity or quantitative outcomes whose meaning is incomplete without context.
Important limitations: Longer duration, risk of phase-two confirmation bias, difficulties recontacting participants, and possible mismatch between the population represented in phase one and the smaller qualitative sample.
Defining the phase-one population
The quantitative population must first be appropriate for the primary quantitative question. If phase one is biased or poorly measured, qualitative explanation cannot repair it. The design should therefore address the same sampling, measurement, confounding and missing-data issues that would matter in a standalone quantitative study.
Defining the phase-two population
The qualitative sample is usually drawn from, or connected to, the phase-one population. This creates opportunities for purposeful sampling based on known quantitative characteristics.[6]
Common strategies include:
- extreme or deviant cases, such as unexpectedly high or low outcome values;
- maximum variation, covering contrasting profiles;
- typical cases, representing the dominant quantitative pattern;
- criterion-based sampling, such as all participants with a particular exposure-outcome combination; and
- negative or disconfirming cases, selected because they do not fit the preliminary interpretation.
The sample should be justified by the explanatory purpose, not by a fixed percentage of the phase-one cohort.
Sampling and recruitment
Purposeful sampling in the qualitative phase should use quantitative information without reducing participants to their numerical profiles. Palinkas and colleagues describe purposeful sampling strategies relevant to mixed-method implementation research and stress alignment with the research purpose.[6]
A practical sampling matrix might include:
| Quantitative profile | Completion status | Why recruit? |
|---|---|---|
| younger, long travel | not completed | explore barriers consistent with the observed pattern |
| younger, long travel | completed | identify protective or enabling factors |
| older, short travel | not completed | examine disconfirming cases |
| older, short travel | completed | provide a comparison profile |
This matrix is illustrative. It shows how the qualitative sample is connected to the quantitative results.
Pre-specify how phase two will be triggered
- Define which quantitative results may trigger qualitative follow-up.
- State who will make the transition decision and using what criteria.
- Specify whether phase-two participants must come from the phase-one sample.
- Describe how consent for recontact will be obtained.
- Plan purposive selection of contrasting and disconfirming cases.
- Explain how many interviews are anticipated and how adequacy will be judged.
- Allow the interview guide to be refined from phase-one findings while documenting changes.
Variables, constructs and measurements
The quantitative measures define patterns; the qualitative phase examines how those patterns are experienced or produced. Researchers should therefore map quantitative variables to qualitative topics without assuming equivalence.
For example, a quantitative variable labelled distance_to_hospital_km measures geographical distance. Interviews may reveal transport cost, traffic, travel with an infant, dependence on another adult, opening hours and uncertainty about where testing can be done. The qualitative construct is broader than the numerical variable.
This distinction can improve measurement. The integrated study may conclude that geographical distance was an imperfect proxy for access burden, suggesting better variables for future research.
Procedures and data collection
A transparent explanatory sequential workflow is:
- complete quantitative data cleaning and prespecified analysis;
- identify results requiring explanation;
- document the rationale for choosing those results;
- construct the qualitative sampling matrix;
- recruit eligible phase-two participants;
- adapt the interview or focus-group guide to the selected findings;
- analyse qualitative data using an appropriate qualitative approach; and
- integrate the phase-one and phase-two findings.
The time between phases matters. If the interval is long, participants’ circumstances may change, weakening the explanatory link.
Bias, validity and quality assurance
Other threats include:
- phase-one model dependence: qualitative sampling may be built on a misspecified model or arbitrary cut-point;
- recontact bias: participants willing to return for interviews may differ systematically from those who decline;
- temporal drift: interviews months later may explain current circumstances rather than those operating at the time of the quantitative outcome;
- researcher anchoring: interviewers may frame questions around the initial quantitative interpretation too strongly; and
- selective integration: only qualitative themes that fit the quantitative results are carried into the final narrative.
Quality assurance should include an audit trail showing how phase-one results produced phase-two decisions and how qualitative findings changed the final interpretation.
Ethical and governance considerations
Sensitive quantitative profiles can create disclosure risks. A participant should not be told that they were recruited because they were an “outlier” in a stigmatising way. Recruitment language can describe the need for a range of experiences without revealing analytic labels.
Interface with statistical analysis
The quantitative analysis should be completed according to its own design requirements before qualitative sampling decisions are made. The phase-two sample is not usually intended for statistical estimation, so frequencies within the interview sample should not be treated as population prevalence.
When choosing cases from a regression model, preserve the relevant quantitative uncertainty. For example, a subgroup estimate with a wide confidence interval should be described as uncertain rather than converted into a definitive “high-risk” category simply to simplify sampling.
Similarly, qualitative explanations do not turn an observational association into a causal effect. They can make mechanisms plausible, identify alternative explanations, and guide future causal research.
Worked example
Explaining an unexpected age pattern
Phase one: Among 800 eligible women, younger age, longer travel time and absent referral documentation are associated with lower testing completion. Younger women nevertheless have high risk-knowledge scores.
Explanatory problem: Knowledge alone does not explain why younger women complete testing less often.
Connecting decision: The team selects 28 women across age, travel and completion profiles, deliberately including younger completers and older non-completers.
Qualitative findings: Younger women commonly describe returning to work, fragmented childcare, uncertainty about where testing can be done and prioritising infant appointments. Some younger completers describe flexible workplace arrangements and testing at nearby primary-care clinics.
Integrated interpretation: The quantitative association with age should not be interpreted as an age effect in itself. Qualitative evidence suggests that age may index a cluster of life-stage and service-access conditions. The combination of flexible testing locations, continuity of referral and practical support becomes a more actionable service hypothesis than “target younger women”.
The values and findings are illustrative.
A joint display can make the transition explicit:
| Quantitative result | Qualitative explanation | Integrated implication |
|---|---|---|
| Younger age associated with lower completion | return-to-work and childcare coordination prominent | examine life-stage access constraints rather than age alone |
| Long travel associated with lower completion | cost and dependence on family transport compound distance | measure multidimensional access burden |
| Referral documentation associated with completion | women value knowing exactly where and when to test | strengthen handover and actionable discharge communication |
Joint displays can support integrated analysis by organising related evidence rather than relegating integration to prose alone.[3]
Suggested protocol or reporting wording
Common mistakes
Knowledge check
What is the defining integration point in an explanatory sequential design?
Answer and reasoning
The key integration point is the transition from phase one to phase two. Quantitative results must inform qualitative sampling, data collection or both. Integration then continues when the two sets of findings are interpreted together.
Why should disconfirming cases be included in phase-two sampling?
Answer and reasoning
They test whether the emerging explanation is too narrow. A participant who does not fit the dominant quantitative pattern may reveal enabling factors, measurement problems or alternative mechanisms that materially improve the integrated interpretation.
Can qualitative follow-up prove why an observational association occurred?
Answer and reasoning
Usually not. Qualitative evidence can identify plausible mechanisms and contextual explanations, but causal inference still depends on the overall design, temporality, confounding control and other causal assumptions.
Why is statistical significance a poor sole criterion for deciding which result to explain?
Answer and reasoning
Because explanatory importance depends on clinical relevance, uncertainty, novelty and actionability as well as the p-value. A clinically important subgroup pattern may warrant follow-up even if its estimate is imprecise.
Key take-home messages
Key take-home messages
- Explanatory sequential studies begin with quantitative analysis and use selected results to shape qualitative follow-up.
- The connecting decision between phases must be explicit and auditable.
- Sample contrasting and disconfirming cases, not only participants who support the initial quantitative interpretation.
- Integration should explain, elaborate or challenge quantitative findings without overstating causality.
- Plan recontact, timing and data linkage before phase one begins.
- Report how phase-one findings changed phase-two sampling, questions and final interpretation.
References
- Ivankova NV, Creswell JW, Stick SL. Using mixed-methods sequential explanatory design: from theory to practice. Field Methods. 2006;18(1):3–20. https://doi.org/10.1177/1525822X05282260
- Fetters MD, Curry LA, Creswell JW. Achieving integration in mixed methods designs—principles and practices. Health Serv Res. 2013;48(6 Pt 2):2134–2156. https://doi.org/10.1111/1475-6773.12117
- Guetterman TC, Fetters MD, Creswell JW. Integrating quantitative and qualitative results in health science mixed methods research through joint displays. Ann Fam Med. 2015;13(6):554–561. https://doi.org/10.1370/afm.1865
- O’Cathain A, Murphy E, Nicholl J. Three techniques for integrating data in mixed methods studies. BMJ. 2010;341:c4587. https://doi.org/10.1136/bmj.c4587
- Schoonenboom J, Johnson RB. How to construct a mixed methods research design. Köln Z Soziol. 2017;69(Suppl 2):107–131. https://doi.org/10.1007/s11577-017-0454-1
- Palinkas LA, Horwitz SM, Green CA, Wisdom JP, Duan N, Hoagwood K. Purposeful sampling for qualitative data collection and analysis in mixed method implementation research. Adm Policy Ment Health. 2015;42(5):533–544. https://doi.org/10.1007/s10488-013-0528-y
These materials support learning and research planning. They require adaptation to the study context and do not replace methodological, statistical, ethical, or regulatory consultation.