
Part 16 · Module 7
Secondary Data, Medical Records and Registry Research
Learn to design rigorous studies using medical records, registries and routinely collected health data while addressing provenance, bias and governance.
Learning outcomes
After completing this lecture, you should be able to:
- Distinguish secondary use of existing data from prospectively designed primary data collection.
- Define a study population, time origin, exposure and outcomes from routinely collected data.
- Assess data provenance, completeness, coding validity and changes in data-generating processes.
- Identify common biases in electronic-record and registry research, including immortal-time and misclassification bias.
- Apply appropriate governance and reporting principles for secondary health-data research.
Overview
Secondary-data research uses information collected for a purpose other than the current research question, including electronic health records, administrative claims, disease registries, clinical-quality databases and linked public-health systems. These sources can support large, efficient and clinically relevant studies, but their variables arise from real care and administrative processes rather than from a research protocol. The RECORD statement extends STROBE to improve reporting of observational studies using routinely collected health data, including descriptions of codes, algorithms, linkage and derivation of the study population.[1–3] Ethical and data-stewardship guidance further requires proportionate governance, privacy protection and clear provenance.[4–6]
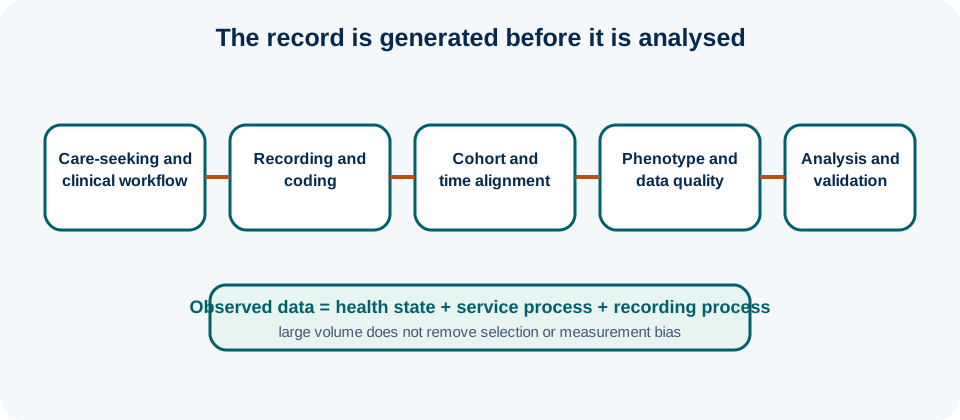
The central methodological question is not simply whether the database is “big”. It is whether the available data can validly represent the population, time order, exposure, outcome, confounding structure and follow-up required by the research question.
Why this matters
Routinely collected data can create a false sense of objectivity. Laboratory values appear precise, diagnoses have official codes, and large sample sizes produce narrow confidence intervals. Yet diagnosis codes may reflect billing practices, test frequency may depend on disease severity, and absence of a record may mean “not measured”, “measured elsewhere”, “not coded” or truly “absent”. A large dataset can therefore estimate a biased quantity very precisely.
Secondary data also require different feasibility thinking. Researchers cannot simply add a variable after the study begins if it was never captured. Data systems change over time; new coding systems, laboratory assays, hospital mergers or EHR upgrades can produce artificial trends. The protocol should therefore include a data-feasibility stage before finalising the research question and analysis.
Key concepts
A data-generating process is the clinical, administrative and technical mechanism that determines whether a variable appears in the dataset. Understanding it is as important as understanding the statistical distribution. For example, a missing creatinine level may reflect a clinician’s decision not to order the test, which can itself depend on prognosis.
A computable phenotype is an algorithm that operationalises a condition, exposure or outcome using codes, tests, medications, notes or combinations of fields. Phenotypes should be validated or justified for the intended context. A code set developed in one health system may perform differently in another because coding incentives, clinical pathways and data capture differ.
Time zero is crucial. Eligibility, exposure assignment and the start of follow-up should be aligned so that participants must be alive and observable under comparable conditions at cohort entry. Defining exposure using future information can create immortal-time bias. Similarly, requiring a future laboratory test for inclusion can condition on post-baseline behaviour and distort selection.
Before committing to a secondary-data study, verify these elements
- whether the source population represented in the database matches the target question;
- whether time zero, eligibility and exposure can be defined without future information;
- whether primary outcomes are captured with adequate completeness and validity;
- whether key confounders or predictors are available at the required time;
- whether linkage, coding and system changes can be documented;
- whether governance permits the planned use, linkage, retention and sharing.
A step-by-step methodological workflow
1. Interrogate the database before finalising the protocol
Meet data custodians, clinicians and informatics staff. Review data dictionaries, coverage dates, coding systems, linkage keys and known gaps. Run feasibility counts for the target population and key variables without conducting the final hypothesis test. If the outcome is incompletely captured, revise the question or obtain additional linkage rather than relying on sample size to compensate.
2. Define cohort construction algorithmically
Translate eligibility into computable rules with explicit look-back windows, washout periods and index dates. Preserve a flow table showing how many records remain after each criterion. Avoid exclusions based on information measured after cohort entry unless the design explicitly requires it and the consequences are understood.
3. Validate exposures, outcomes and covariates
Use validated coding algorithms where suitable and document adaptations. For high-impact variables, perform chart review or linkage validation on a sample when feasible. Report positive predictive value, sensitivity or agreement of phenotypes if known, but remember that validity can vary by setting and calendar time.
4. Model the observation process
Ask why some people have more measurements, more visits or more complete records. Healthcare utilisation can be both a confounder and a mechanism of ascertainment. Consider whether missingness, informative testing or differential follow-up requires weighting, multiple imputation, sensitivity analysis or restriction.
5. Track temporal and technical changes
Document EHR migrations, coding transitions, laboratory assay changes, policy changes and major disruptions such as service reconfiguration. Plot key variable frequencies over calendar time. Sudden discontinuities may reflect data-system changes rather than epidemiology.
6. Preserve provenance and report transparently
Version code lists, phenotype algorithms and cohort-extraction scripts. Separate source extraction from analytic derivation. RECORD recommends transparent reporting of study-population selection, codes and algorithms.[1] Where sharing patient-level data is restricted, share code lists, metadata and analysis code when permitted and describe the controlled-access route.
Secondary-data protocol items
- database purpose, coverage, custodianship and source population;
- cohort entry, look-back, eligibility and follow-up rules;
- exposure, outcome and confounder algorithms with code lists;
- linkage methods and handling of duplicate or conflicting records;
- data-quality and phenotype-validation procedures;
- missingness, informative observation and out-of-network care;
- calendar-time and system-change assessment;
- privacy, data-access, retention and sharing governance.
An auditable planning document
Routinely collected data provenance table
illustrativeTable 1. Illustrative provenance table
| Variable | Source system | Operational rule | Main limitation |
|---|---|---|---|
| Heart-failure admission | Inpatient EHR | Admission + qualifying diagnosis algorithm | Coding variation |
| Early follow-up | Outpatient scheduling/EHR | Completed visit within 7 days | Outside-network visits missing |
| 30-day readmission | Inpatient EHR + linked claims | Any qualifying admission within 30 days | Linkage lag |
| Baseline renal function | Laboratory system | Most recent value in look-back window | Informative testing |
| Medication use | Pharmacy list | Active prescription at discharge | Dispensing/adherence not guaranteed |
Note: Provenance should describe what the field represents, not only its variable name.
Quality, validity and governance
Selection and information bias can enter before any analysis is run. Patients who receive follow-up may differ in severity, social support, healthcare engagement and insurance coverage. Patients with out-of-network readmissions may be misclassified as event-free. A causal question therefore requires a conceptual framework and sufficient confounder measurement; an association adjusted for available variables is not automatically causal.
Data quality is multidimensional: completeness, conformance, plausibility, timeliness, uniqueness and stability can all matter. A variable may be 99% complete but systematically wrong after a coding transition. Conversely, a variable with moderate missingness may still support valid inference under an appropriate design and missing-data assumption. The study should prioritise dimensions that affect the primary objective.
Governance should recognise residual re-identification risk even after direct identifiers are removed. Linkage keys, rare diagnoses, dates and combinations of variables can remain identifying. Ethical and privacy review should consider the intended use, security controls, access model and participant/community expectations.[4–6]
Appraise a routinely collected data study
- Is the data source appropriate for the target population and outcome?
- Is cohort entry aligned with eligibility, exposure and start of follow-up?
- Are code lists and phenotype algorithms available or sufficiently described?
- Could healthcare utilisation or testing frequency distort measurement?
- Are out-of-network events, migration and loss of observability addressed?
- Were important data-system changes and governance constraints reported?
Practical decision audit
Audit time zero for immortal time
Draw the participant timeline. If exposure requires surviving until a later date, either define cohort entry at that date for both groups or use an analysis that properly handles time-varying exposure. Do not classify future exposure status at baseline while counting earlier event-free time as exposed.
Audit missingness as information
Compare missingness by site, calendar time, disease severity and healthcare use. Missing laboratory data may indicate better health, poorer access or care elsewhere. The appropriate approach depends on the mechanism; blanket deletion can change the study population and bias associations.
Audit coding stability
Plot code frequencies and data completeness before and after EHR upgrades, reimbursement changes or policy shifts. Maintain versioned code sets. If phenotype logic changes during the study period, prespecify whether calendar-period stratification or sensitivity analyses are required.
Audit external validity
A hospital data warehouse represents people who interact with that hospital. It may not represent community members who receive care elsewhere or never attend. Describe the source population and care network honestly rather than calling a large database “population based” without evidence.
Target-trial thinking clarifies causal secondary-data studiesMMed extension
For causal questions, secondary-data studies often benefit from explicitly describing the hypothetical randomised trial that the observational analysis seeks to emulate: eligibility, treatment strategies, assignment, time zero, follow-up, outcome, causal contrast and analysis. This exercise exposes common errors such as using future information to classify baseline exposure, comparing prevalent users with initiators, or adjusting for post-treatment variables.
Target-trial thinking does not make confounding disappear. It clarifies the estimand and design so that remaining assumptions—exchangeability, positivity, consistency and correct measurement—can be assessed. When the data cannot support those assumptions, the responsible response may be to narrow the question rather than apply a more complex model.
Advanced design problems in routinely collected health data
Secondary-data studies often fail at the design stage, long before the statistical model. The first advanced task is to distinguish the clinical event from its recorded representation. A diagnosis can exist without a code, a code can be entered for rule-out purposes, and a medication list can reflect prescription rather than dispensing or ingestion. Each important variable should therefore have a validity argument that links the observed data element to the underlying construct.
New-user designs can reduce treatment-history bias
In pharmacoepidemiology and comparative-effectiveness work, comparing prevalent users can create selection because participants have already survived and tolerated treatment. A new-user design identifies people at treatment initiation and aligns baseline covariates before that point. Active-comparator designs can further improve comparability by selecting people facing a similar treatment decision. These strategies do not eliminate confounding, but they make the causal contrast more interpretable.
Observation windows must be clinically defensible
Look-back periods determine how baseline disease and prior treatment are classified. A one-year look-back may miss long-standing disease if care occurred elsewhere; a very long look-back may include obsolete history. Follow-up can end at death, disenrolment, database end, treatment change or outcome depending on the estimand. Each rule changes who remains observable and what event rate is being estimated.
Data linkage creates both opportunity and bias
Linking hospital data with claims, mortality or registry data can improve outcome completeness, but linkage errors are not neutral. False matches can create events for the wrong person; missed matches can appear as outcome-free follow-up. Report deterministic or probabilistic linkage methods, identifiers used, match quality and how uncertain links were handled. If linkage success differs by age, ethnicity, migration status or site, selection bias may result.
Negative controls can probe residual bias
When suitable, negative-control outcomes or exposures can reveal systematic associations that should not exist under the causal hypothesis. A surprising negative-control association may indicate residual confounding, measurement bias or selection. Negative controls do not prove the primary estimate is unbiased when null, but they can strengthen a broader bias analysis.
Calendar time can be a confounder and a data-quality dimension
Treatment practices, eligibility rules, diagnostic criteria and coding systems evolve. A treatment adopted later may appear superior because supportive care also improved. Calendar time should be considered in design and analysis, particularly when exposures are strongly time-patterned. Interrupted periods, coding transitions and policy changes should be visualised and documented.
Missingness can reflect care pathways rather than random loss
In EHR data, a missing test often means it was not clinically indicated or was performed outside the network. Standard multiple-imputation assumptions may be implausible if the observation process is strongly informative and important predictors of that process are absent. Sensitivity analyses should consider plausible mechanisms and, where appropriate, alternative outcome definitions or linkage sources.
Registry quality depends on case ascertainment and follow-up rules
Disease registries may have explicit inclusion criteria but still vary in completeness by hospital, disease severity or calendar year. Understand whether case ascertainment is active or passive, whether data are audited, how deaths and migrations are captured, and whether sites enter data prospectively or retrospectively. A registry is not automatically population-based merely because it is called a registry.
Reproducible phenotype development should be treated as methodology
Store code lists, natural-language rules, temporal logic and validation results as versioned research objects. If machine-learning phenotypes are used, document training data, reference labels, performance and transportability. When phenotype thresholds are tuned on the same dataset used for the main association, the resulting analysis can overfit to local coding patterns.
Interpretability begins with the source population
A hospital EHR cohort may answer a highly relevant question for patients receiving care in that system, even if it does not represent the national population. The problem is not limited representativeness itself; the problem is claiming a broader target population than the data support. Define the target explicitly and distinguish generalisation beyond the observed system from internal validity within it.
Emulating a defensible longitudinal study from routine data
A protocol for routinely collected data should specify the sequence by which a person becomes eligible, enters follow-up, is classified with respect to exposure and becomes at risk for the outcome. These steps should occur in a clinically coherent order. If exposure classification requires surviving or remaining event-free for a period after cohort entry, that period may become immortal time unless the design or analysis represents exposure as time varying or moves time zero appropriately.
The same discipline is needed for comparator construction. In comparative effectiveness research, a new-user active-comparator design can make treatment groups more comparable by aligning the clinical decision that initiates follow-up and avoiding mixtures of prevalent users with very different treatment histories. This design is not universally appropriate, but it illustrates a broader principle: routine databases do not define the target trial automatically; the investigator must reconstruct an explicit decision process from the available records.
Record the exact code lists, look-back windows, washout rules, linkage fields, permissible gaps and censoring rules used to build the cohort. When coding systems or clinical workflows change over calendar time, freeze versioned phenotype definitions and examine whether incidence, missingness or variable meaning changes abruptly. A result that depends heavily on one coding era, one linkage rule or one undocumented transformation should be treated as fragile until the mechanism is understood.
Data fitness should be demonstrated, not assumed
Before a large secondary-data study proceeds, produce a data-fitness profile for the variables central to eligibility, exposure, outcome and confounding control. Examine completeness, plausible ranges, temporal coverage, duplicate identifiers, coding transitions and whether the variable was recorded for all patients or only after particular clinical encounters. A field that exists in the database is not necessarily measured consistently enough to support the intended inference.
When feasible, validate key computable phenotypes against an independent source or manual record review in a relevant sample. Report not only agreement statistics but also how validation cases were selected and whether performance could vary across sites or calendar periods. If validation is impossible, the protocol should state the resulting uncertainty and plan sensitivity analyses using plausible alternative definitions rather than presenting the code-based phenotype as a flawless measurement.
Worked example
Designing the heart-failure follow-up cohort
The team defines cohort entry as discharge alive after an eligible heart-failure admission. The exposure is a completed outpatient follow-up visit within seven days. Because exposure is not known at discharge, the investigators recognise that classifying patients as “early follow-up” from day zero would create immortal time. They redesign the study using an appropriate landmark or time-varying strategy consistent with the causal question.
Readmissions are obtained from a linked claims source rather than the hospital EHR alone, reducing outcome under-ascertainment. Baseline confounders are measured before discharge using prespecified look-back windows. The team validates a sample of heart-failure diagnosis records, plots coding and laboratory completeness across calendar time, and documents a major EHR migration.
The final report follows STROBE with RECORD-specific details, including the code lists, cohort derivation and data linkage. The conclusion describes an adjusted association and the assumptions required for causal interpretation rather than claiming that a follow-up visit “prevented” readmission simply because the adjusted hazard ratio was below one.
Suggested protocol and manuscript wording
Common mistakes
Knowledge check
Why can missing laboratory tests be informative in EHR research?
Answer and reasoning
Testing is often ordered because of clinical concern, healthcare access or disease severity, so missingness can be related to prognosis and the observation process.
What is immortal-time bias?
Answer and reasoning
Bias created when a period during which the outcome cannot occur for someone to be classified as exposed is incorrectly attributed to the exposed group.
Why publish code lists or phenotype algorithms when patient-level data cannot be shared?
Answer and reasoning
They improve transparency and reproducibility of how constructs and the study population were derived without disclosing individual records.
Does a validated code algorithm automatically remain valid in every database?
Answer and reasoning
No. Coding systems, incentives, clinical practice and data capture differ by setting and time, so transportability of phenotype performance must be considered.
Key take-home messages
Key take-home messages
- Understand the data-generating process before trusting routinely collected variables.
- Align cohort entry, exposure assignment and follow-up to avoid time-related bias.
- Validate or justify computable phenotypes and track changes in coding systems.
- Model healthcare utilisation, missingness and observability as methodological issues.
- Use transparent reporting and proportionate governance for secondary health-data research.
References
- Benchimol EI, Smeeth L, Guttmann A, et al. The REporting of studies Conducted using Observational Routinely-collected health Data (RECORD) statement. PLoS Med. 2015;12(10):e1001885. https://doi.org/10.1371/journal.pmed.1001885
- von Elm E, Altman DG, Egger M, Pocock SJ, Gøtzsche PC, Vandenbroucke JP. The STROBE statement: guidelines for reporting observational studies. PLoS Med. 2007;4(10):e296. https://doi.org/10.1371/journal.pmed.0040296
- Wilkinson MD, Dumontier M, Aalbersberg IJJ, et al. The FAIR Guiding Principles for scientific data management and stewardship. Sci Data. 2016;3:160018. https://doi.org/10.1038/sdata.2016.18
- World Medical Association. Declaration of Helsinki: ethical principles for medical research involving human participants. Ferney-Voltaire: WMA; 2024. https://www.wma.net/what-we-do/medical-ethics/declaration-of-helsinki/
- Council for International Organizations of Medical Sciences. International ethical guidelines for health-related research involving humans. Geneva: CIOMS; 2016. https://cioms.ch/publications/product/international-ethical-guidelines-for-health-related-research-involving-humans/
- National Institutes of Health. Data Management & Sharing Policy overview. Updated 2026. https://grants.nih.gov/policy-and-compliance/policy-topics/sharing-policies/dms/policy-overview
These materials support learning and research planning. They require adaptation to the study context and do not replace methodological, statistical, ethical, or regulatory consultation.