
Part 14 · Module 2
Selection Bias
Recognise how selection into a study or analysis can distort health-research estimates, and design recruitment, follow-up and analysis to reduce selection bias.
Learning outcomes
After completing this lecture, you should be able to:
- Define selection bias by its mechanism rather than by lack of representativeness alone.
- Identify selection bias during recruitment, follow-up and construction of the analysis sample.
- Explain how conditioning on a collider can create a spurious exposure-outcome association.
- Distinguish selection bias affecting internal validity from limitations in generalisability.
- Plan design and analytical strategies that reduce or assess selection bias.
Overview
Selection bias arises when the association or contrast among participants included in an analysis differs systematically from the association that would have been observed in the eligible source population because inclusion, retention or analysis depends on variables related to the exposure and outcome. Structural explanations show that this often occurs when the analysis conditions on a common effect—a collider—of causes of exposure and outcome.[1]
Selection bias is therefore more specific than “the sample is not representative”. A convenience sample may have limited generalisability without biasing an internal exposure-outcome comparison. Conversely, a large population-based cohort can develop selection bias if follow-up or inclusion in the analysis depends jointly on exposure and prognosis.
Why this matters
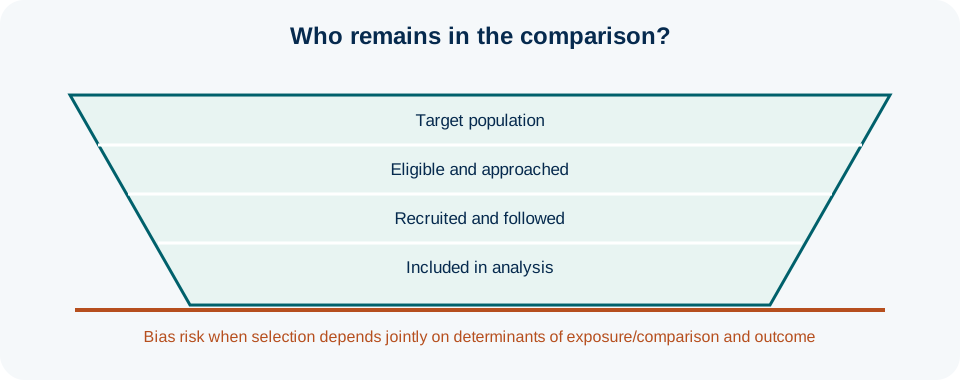
Selection processes occur repeatedly: who is reachable, who consents, who completes measurements, who remains under follow-up, whose records link successfully, and whose observations satisfy a complete-case analysis. Each step can change the analysed population.
Because selection bias is created by the data-generating and inclusion mechanisms, conventional regression adjustment does not automatically remove it. Prevention, documentation and mechanism-based sensitivity analysis are more defensible than simply “adjusting for everything”.[1,2]
Key concepts
Selection bias can occur at entry, follow-up or analysis. At entry, participation may depend on exposure and disease or on their causes. During follow-up, attrition can depend on treatment, exposure, prognosis or adverse effects. At analysis, investigators may restrict to participants with complete data, adherers, survivors or people with a post-baseline characteristic that is influenced by both exposure and outcome determinants.[1]
The causal structure matters more than the percentage selected. Ten per cent loss to follow-up can create severe bias if loss strongly depends on prognosis differently by exposure; 30% loss can create little bias under some mechanisms. Percentages are therefore warning signals, not direct measures of bias.
Study-base logic and entry into the study
In cohort studies, recruitment should preserve meaningful comparison of exposed and unexposed participants from the source population. In case-control studies, controls must represent the exposure distribution of the population that generated the cases. Selecting controls because they are especially healthy, convenient or easily accessible can break that logic.
Participation can also depend on healthcare access, language, digital literacy or perceived health. Documenting the denominator at each recruitment stage helps readers understand who was eligible, approached, enrolled and analysed. STROBE recommends transparent reporting of participant flow and efforts to address potential sources of bias.[2]
Collider conditioning
A collider is a variable influenced by two other variables. Conditioning on it—through restriction, stratification, adjustment or selection—can create an association between its causes even when none existed before selection. For example, hospital admission may be influenced by both an exposure and disease severity. Studying only admitted patients can create associations that do not reflect the source population.
The same logic applies to selected complete cases if data completeness depends on both an exposure-related factor and an outcome-related factor. Causal diagrams can help identify when a proposed restriction opens rather than closes a biasing pathway.[1,3]
Loss to follow-up and attrition
Attrition is a selection process when continued observation depends on variables related to the comparison of interest. Compare characteristics of retained and lost participants, but do not assume that similar measured baseline variables prove the absence of bias: the selection mechanism can involve unmeasured factors.
Retention strategies—multiple contact modes, participant-friendly scheduling, tracing procedures and outcome collection after intervention discontinuation when ethically appropriate—are validity safeguards, not merely administrative tasks.
Analysis strategies
Inverse-probability weighting can reweight observed participants to represent those who would have remained under a specified model of selection. The method requires adequate modelling of selection probabilities, positivity and measured predictors of selection and outcome.[4] Multiple imputation may address some forms of missing data but is not conceptually interchangeable with weighting.
No method can recover information reliably when the selection mechanism depends strongly on unmeasured variables without additional assumptions. Sensitivity analysis should therefore be considered when selection is plausibly informative.
Selection versus transportability
A selected sample can still estimate a valid internal association if selection is unrelated to the outcome conditional on the analysis structure, yet the estimate may apply poorly to a broader target population. Conversely, weighting a sample to population demographics does not automatically remove internal selection bias. Keep the internal and external questions separate.
Prevention checklist
Before recruitment, identify the source population, enumerate feasible recruitment routes, specify eligibility independent of future outcomes, avoid unnecessary post-exposure restrictions, and plan retention for the primary outcome. During analysis, account for the reasons observations are missing or excluded and document the analytical denominator for each result.
Diagnose a selection problem in five questions
- Who was eligible for the comparison before selection occurred?
- What process determined entry, retention or inclusion in the analysis?
- Which causes of exposure or outcome influence that process?
- Does conditioning on selection open a non-causal pathway or change the target population?
- Can the problem be prevented, modelled, weighted or stress-tested using available information?
Participant-flow audit
illustrativeTable 1. Illustrative selection audit
| Stage | Number | Main reason for exclusion or loss | Variables plausibly related to selection |
|---|---|---|---|
| Eligible | 1,250 | — | — |
| Contactable | 1,090 | Invalid contact details | Clinic, socioeconomic status, mobility |
| Consented | 860 | Declined or unavailable | Health literacy, perceived burden |
| 12-week outcome available | 742 | Unable to contact / external care | Access burden, symptoms, healthcare use |
| Complete-case analysis | 681 | Missing covariates | Education, site, record completeness |
The table does not quantify bias by itself; it identifies where mechanisms require examination.
Questions for appraising selection bias
- Was the source population defined before participants were selected?
- Could recruitment or participation depend jointly on exposure and outcome determinants?
- Were reasons for non-participation and loss to follow-up documented by study group where appropriate?
- Did the analysis condition on post-exposure variables such as adherence, survival or complete data without causal justification?
- Were selection assumptions examined through weighting or sensitivity analyses when necessary?
Inverse-probability-of-selection weightingMMed extension
Let indicate inclusion in the analysed sample. Under suitable exchangeability and positivity assumptions, participants can be weighted by the inverse of the estimated probability of being selected conditional on measured variables. Stabilised weights are often used to reduce variance. Extreme weights indicate sparse support or model problems and should prompt diagnostics rather than automatic truncation. Weighting changes the pseudo-population represented by the analysis; the estimand must therefore be stated clearly.[4]
Selection mechanisms across common study designs
The practical form of selection bias differs by design. In a case-control study, the central question is whether controls represent the exposure distribution in the population that generated the cases. Controls do not need to resemble cases on every characteristic. They need to arise from the same study base and to have been capable, in principle, of becoming a case had the outcome occurred. Selecting especially healthy hospital controls, selecting controls according to future exposure status, or using a source population that could not have generated the cases can distort the exposure odds ratio even when measurements are otherwise excellent.[1,5]
In a cohort study, selection can occur at cohort entry and again during follow-up. Restricting participation to volunteers who are unusually health-conscious may change the population to which estimates apply. More importantly for internal validity, participation can bias an exposure-outcome association when entry depends jointly on determinants of exposure and outcome. During follow-up, informative loss can create a similar problem if remaining under observation depends on prognosis as well as exposure or treatment history.[1]
In a randomised trial, randomisation protects the initial treatment comparison only after eligible participants have entered the trial and been randomised. Pre-randomisation recruitment can still restrict generalisability, while post-randomisation exclusions, differential withdrawal, missing outcome assessment, or analysis according to treatment received can undermine the initial comparability created by randomisation. Preserving the randomised groups in analysis is therefore a design principle, not merely a statistical convention.
Selection through eligibility, data linkage and analysis datasets
Selection is sometimes introduced by apparently routine data-processing decisions. Requiring a complete baseline laboratory panel, successful linkage to a second database, attendance at a particular follow-up visit, or availability of a biospecimen can silently redefine the analysed population. If those requirements are related to exposure and outcome determinants, the resulting complete-record or successfully linked sample may no longer preserve the intended comparison.[1,3]
For linked routine-data studies, investigators should report the number eligible for linkage, the number successfully linked, the variables used for linkage, and whether linkage success differs across relevant participant characteristics. For biomarker substudies, investigators should distinguish the original cohort from the specimen-available subset. For multivariable analyses, the number entering each model should be transparent rather than hidden behind a final regression table.
A useful operational habit is to maintain a selection cascade: potentially eligible → confirmed eligible → approached → consented → enrolled → exposure/treatment classified → outcome observed → included in each principal analysis. The cascade helps the team identify where and why the population changes. It also makes clear which losses affect external validity primarily and which can threaten the internal comparison.
Monitoring and diagnosing selection during study conduct
Selection bias cannot usually be diagnosed from a single statistical test. Monitoring should therefore focus on the process that creates inclusion. Investigators can compare recruitment fractions by site and time, reasons for non-participation, baseline characteristics of retained and lost participants when available, and outcome-observation rates across exposure or treatment groups. These summaries do not prove absence of bias, but they reveal mechanisms that deserve causal and sensitivity analysis.[2]
Differences between participants and non-participants should also be interpreted carefully. A difference in age or disease severity does not by itself prove that the exposure-outcome estimate is biased. Bias depends on how selection relates to the variables that generate the comparison. Conversely, similar observed characteristics do not guarantee freedom from bias because unmeasured causes of selection may still operate.
When inverse-probability weighting is used, investigators should inspect the estimated selection probabilities and the resulting weights. Very large or unstable weights may indicate poor overlap and reliance on a small number of observations.[4] Weighting also depends on correct modelling of the selection process; it cannot repair selection mechanisms that were never measured or adequately represented.
Interface with statistical analysis
Selection mechanisms determine which statistical population is represented by the analysed data. Complete-case analysis, inverse-probability weighting and multiple imputation rely on different assumptions. Statistical adjustment for baseline covariates should not be confused with correction for selection created after exposure. The Biostatistics lectures on missing data and causal bias provide the analytical detail.
Worked example
Attrition in the postpartum access-burden cohort
Suppose 900 women enter the cohort. Outcome data are available for 85% of women with low access burden but only 65% with high burden. Among women who develop symptoms, hospital records often reveal whether testing occurred even when telephone follow-up fails.
A naive complete-case analysis includes a selected subset whose retention depends on access burden and subsequent healthcare contact. The team first maps the mechanism using baseline socioeconomic factors, clinic, telephone stability and interim healthcare use. They continue record-based outcome ascertainment for participants who discontinue interviews, reducing preventable missingness.
For remaining missing outcomes, the primary analysis uses a prespecified model appropriate to the estimand, and a sensitivity analysis varies assumptions about outcomes among those not observed. If inverse-probability-of-observation weighting is used, weight distributions and positivity are checked. The investigators report the number and reasons lost by exposure group rather than presenting only an overall retention percentage.
This workflow does not guarantee absence of selection bias, but it makes the mechanism explicit and tests whether conclusions depend on plausible assumptions.
Suggested protocol or reporting wording
Common mistakes
Knowledge check
A convenience sample differs greatly from the national population but exposure and outcome are measured without differential selection within the sample. Is selection bias certain?
Answer and reasoning
No. Generalisability is limited, but internal selection bias requires a mechanism by which inclusion distorts the exposure-outcome association. The two concerns should be assessed separately.
Why can restricting an analysis to treatment adherers create bias?
Answer and reasoning
Adherence occurs after treatment assignment and may be influenced by prognosis, adverse effects and behavioural factors. Restricting to adherers can condition on a common effect of treatment-related and outcome-related causes, breaking the original comparability.
Does 5% loss to follow-up guarantee negligible selection bias?
Answer and reasoning
No. Even small loss can matter if it is strongly related to exposure and outcome risk. Conversely, larger loss may produce little bias under less informative mechanisms. The mechanism is more important than the percentage alone.
What information is needed before inverse-probability-of-selection weighting is credible?
Answer and reasoning
Researchers need measured predictors sufficient to model selection, adequate positivity, a defensible target population and a correctly specified or sufficiently robust selection model. Weight diagnostics are also necessary.
Key take-home messages
Key take-home messages
- Selection bias occurs when inclusion in the analysis distorts the comparison of interest.
- Selection can occur at recruitment, follow-up or construction of the analysis sample.
- Conditioning on colliders is a central mechanism for understanding selection bias.
- Attrition percentages alone do not quantify the direction or magnitude of bias.
- Prevention and transparent participant-flow documentation are preferable to relying on post hoc statistical correction.
References
- Hernán MA, Hernández-Díaz S, Robins JM. A structural approach to selection bias. Epidemiology. 2004;15(5):615-625. https://doi.org/10.1097/01.ede.0000135174.63482.43
- von Elm E, Altman DG, Egger M, Pocock SJ, Gøtzsche PC, Vandenbroucke JP. The Strengthening the Reporting of Observational Studies in Epidemiology (STROBE) statement. Lancet. 2007;370(9596):1453-1457. https://doi.org/10.1016/S0140-6736(07)61602-X
- Greenland S, Pearl J, Robins JM. Causal diagrams for epidemiologic research. Epidemiology. 1999;10(1):37-48. https://doi.org/10.1097/00001648-199901000-00008
- Cole SR, Hernán MA. Constructing inverse probability weights for marginal structural models. Am J Epidemiol. 2008;168(6):656-664. https://doi.org/10.1093/aje/kwn164
- Rothman KJ, Lash TL, VanderWeele TJ, Haneuse S. Modern epidemiology. 4th ed. Philadelphia: Wolters Kluwer; 2021.
These materials support learning and research planning. They require adaptation to the study context and do not replace methodological, statistical, ethical, or regulatory consultation.