
Part 14 · Module 5
Random Error, Precision and Reproducibility
Distinguish random error from systematic bias, interpret precision appropriately, and understand reproducibility and replicability as complementary features of trustworthy research.
Learning outcomes
After completing this lecture, you should be able to:
- Distinguish random error, systematic bias and statistical uncertainty.
- Explain how sample size, variability and study design affect precision.
- Interpret confidence intervals as measures of sampling uncertainty under model assumptions.
- Distinguish reproducibility, replicability and measurement repeatability.
- Plan transparent practices that improve reproducibility without confusing it with validity.
Overview
Random error is the variation that arises because a study observes only one realisation of a variable process: one sample, one set of measurements and one sequence of events. It affects the precision of an estimate. Systematic bias is different: it shifts the estimate away from the target because of selection, measurement, confounding or another structured process. Increasing sample size generally reduces sampling variability but does not remove systematic bias.[1]
Reproducibility and replicability address yet another dimension of research credibility. The US National Academies distinguishes reproducibility as obtaining consistent computational results using the same data and methods, and replicability as obtaining consistent results in a new study that addresses the same question.[2] These concepts should not be collapsed into precision or validity.
Why this matters
Researchers frequently overinterpret statistically precise results. A narrow confidence interval can coexist with serious bias, while a wide interval can surround a methodologically unbiased estimate from a small study. Understanding the distinction prevents the false conclusion that a large database is automatically more trustworthy than a carefully designed smaller study.
Transparent analysis, preserved code, versioned data and prespecified decisions improve reproducibility. They also expose analytical errors that might otherwise remain hidden, but they do not guarantee that the study measured the right construct or identified the correct causal effect.
Key concepts
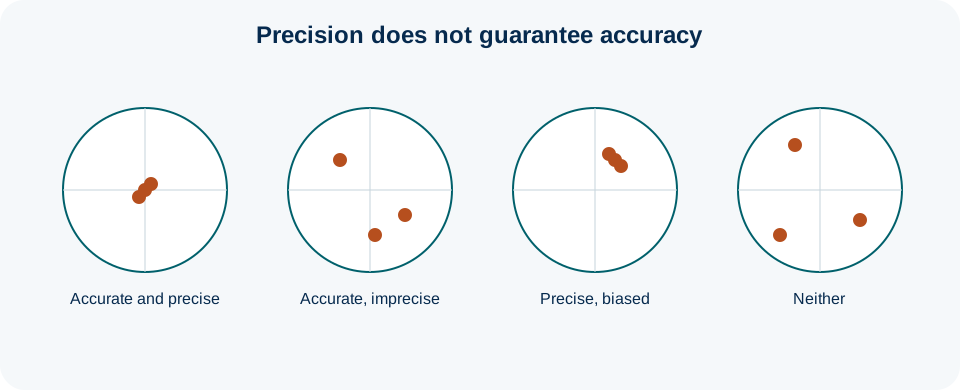
Accuracy is closeness to the target quantity; precision is the degree of statistical uncertainty around an estimate. An estimate can be precise but inaccurate, accurate on average but imprecise in a particular study, or both. Confidence intervals primarily communicate uncertainty due to sampling and the fitted model; they do not automatically incorporate unmeasured confounding, selection bias or misclassification.[1,3]
Reproducibility concerns whether the analytical result can be regenerated from the same inputs. Replicability concerns whether new data provide compatible evidence. Repeatability and reliability are measurement concepts addressed in Part 5 and should not be used as synonyms for computational reproducibility.
Where random error comes from
Sampling variation arises because different random samples contain different participants. Measurement variation arises because biological states and instruments fluctuate. Event counts vary over time. Clustered designs add between-cluster variability. Rare outcomes provide limited information even in otherwise large datasets.
Random error is not the same as careless error. Transcription mistakes are data-quality errors; random error is inherent stochastic variation under the design and measurement process.
Precision and study size
Increasing an effective sample size generally reduces the standard error, often approximately with the square root of sample size under simple designs. Doubling the sample therefore does not halve the standard error. Clustering, repeated measurements, unequal allocation, missing data and low event counts alter the effective information.
Sample-size planning should be tied to the primary estimand and design, not to a generic desire for “large n”. The Biostatistics sample-size section provides numerical procedures.
Confidence intervals and p-values
Confidence intervals are useful because they show a range of parameter values compatible with the data and model assumptions. They should be interpreted in clinical units and alongside the effect estimate. A p-value does not measure the probability that the null hypothesis is true, nor does a value above 0.05 prove no effect. The ASA statement emphasises that scientific conclusions should not depend only on whether a p-value crosses a threshold.[3]
Multiple analyses, outcome switching and selective reporting can also make nominal p-values misleading. Prespecification and transparent reporting are therefore part of uncertainty management.
Reproducibility versus replicability
The National Academies definition is operationally useful: computational reproducibility uses the same data, code and methods; replicability uses new data to ask whether a consistent result can be obtained.[2] Different disciplines have used these words differently, so a research report should define the intended meaning when necessary.
A reproducible analysis can still be biased if the original design was flawed. A non-replicating study may differ because the original estimate was unstable, the new population differs, the intervention was implemented differently, or the original result was biased. Replication is evidence to interpret, not a binary verdict.
Practices that support reproducibility
Preserve raw data or an immutable source extract; maintain a data dictionary; script data transformations where feasible; record software and package versions; version the analysis code; preserve random seeds when relevant; document manual decisions; and archive the final analytical dataset with provenance. When data cannot be shared publicly, metadata, code and synthetic examples can still improve transparency.
Reproducibility should be built into the workflow rather than attempted after publication from undocumented spreadsheets. Transparent data handling and scripted analysis also make recurrent data and analysis errors easier to detect and correct.[4]
Researcher degrees of freedom
Analysts often make many reasonable choices: exclusions, outcome definitions, covariate coding, transformations and model forms. If these choices are made after viewing results and only favourable analyses are reported, apparent precision understates the true uncertainty in the research process. A prespecified primary analysis with transparent sensitivity analyses is more credible than presenting one result selected from many undisclosed alternatives.
Rounding and false precision
Reporting too many decimal places can imply a level of precision unsupported by measurement or design. Conversely, excessive rounding can hide clinically relevant differences. Choose precision that matches the measurement scale and uncertainty. Exact p-values are generally preferable to labels such as “significant” or “non-significant”.
From reproducible files to reproducible decisions
A reproducible workflow should capture not only code but decision provenance: why a variable was recoded, why an outlier was retained, which dataset version was analysed and which analysis was primary. Transparent reporting of participants, variables and statistical methods is likewise central to reproducible interpretation of observational research.[5] A script that perfectly reproduces undocumented post hoc decisions is computationally reproducible but scientifically less transparent.
When an estimate looks convincing, ask four separate questions
- How large is the estimated effect?
- How precise is the estimate under the statistical model?
- What systematic biases could shift the estimate away from the target?
- Can the data-processing and analysis steps be independently reproduced?
- Would the inference plausibly replicate in a new sample or setting?
Uncertainty and credibility map
illustrativeTable 1. Different threats require different responses
| Concern | Typical signal | Main response |
|---|---|---|
| Random error | Wide confidence interval, few events | More information or more efficient design |
| Selection/confounding/information bias | Structured differences between groups | Design safeguards, causal adjustment, bias analysis |
| Computational irreproducibility | Result cannot be regenerated | Versioned data/code and provenance |
| Poor replicability | New studies give materially different results | Examine heterogeneity, bias and original uncertainty |
No single statistic summarises all four concerns.
Questions for precision and reproducibility
- Does the confidence interval reflect clinically meaningful uncertainty rather than only a significance threshold?
- Could important systematic bias dominate the reported sampling uncertainty?
- Are the analysis dataset, transformations and model decisions traceable?
- Could another analyst reproduce the main numerical results from the preserved inputs?
- Are claims of replication or non-replication interpreted in light of differences in population, design and implementation?
Sampling uncertainty is conditional on assumptionsMMed extension
Standard errors and confidence intervals are calculated under assumptions about the design, model, correlation structure and missingness. They do not automatically include uncertainty from choosing among models, imperfect measurement or unmeasured confounding. Bootstrap or robust standard errors can address some forms of sampling/model uncertainty, but they do not transform a biased estimand into a valid one. Sensitivity analysis is used to explore uncertainty that lies outside the primary model.
Interface with statistical analysis
The Biostatistics section explains standard errors, confidence intervals, power and transparent analysis workflows. This lecture supplies the research-methodology interpretation: statistical uncertainty is one component of total uncertainty, and reproducible computation is one component of research credibility. Both must be evaluated alongside bias and construct validity.
Worked example
Interpreting a narrow confidence interval in a large registry
The registry analysis estimates a risk ratio of 1.18 with a 95% confidence interval from 1.15 to 1.21. The interval is narrow because the dataset is large. The investigators first interpret this as high precision for the analysed coded-data contrast.
They then audit the data-generating process and discover that one hospital changed the meaning of the missed-follow-up code during the study period. They rerun the analysis using a harmonised definition and obtain 1.10 with a wider interval. A sensitivity analysis restricted to periods with stable coding gives 1.08.
The team also stores the extraction query, codebook, analysis script and software environment. Another analyst reproduces the tables exactly. The result is now computationally reproducible, but the investigators still discuss possible residual misclassification and confounding.
The lesson is that precision, bias assessment and reproducibility answer different questions. The strongest report presents all three.
Suggested protocol or reporting wording
Common mistakes
Knowledge check
A study doubles its sample size. Does the standard error usually halve?
Answer and reasoning
No. Under simple independent sampling, standard error often decreases approximately with the square root of sample size, so doubling the sample reduces it by about a factor of the square root of two rather than by half.
Can an analysis be perfectly reproducible yet scientifically invalid?
Answer and reasoning
Yes. Reproducibility means the same data and method regenerate the same result. If the underlying design or measurement is biased, the reproduced result can still estimate the wrong quantity.
What does a narrow 95% confidence interval fail to capture automatically?
Answer and reasoning
It does not automatically incorporate unmeasured confounding, selection bias, systematic misclassification, model-selection uncertainty or other non-sampling errors.
What is the practical difference between reproducibility and replicability in the National Academies framework?
Answer and reasoning
Reproducibility uses the same data and computational methods to regenerate a result; replicability uses new data to investigate whether a consistent result is obtained for the same scientific question.
Key take-home messages
Key take-home messages
- Random error mainly affects precision; systematic bias affects accuracy of the target inference.
- Confidence intervals quantify uncertainty under specified design and model assumptions, not all sources of research uncertainty.
- Large samples increase precision but do not automatically reduce systematic bias.
- Reproducibility concerns regeneration from the same data and methods; replicability concerns consistency with new data.
- Transparent, versioned analytical workflows are methodological safeguards, not merely technical conveniences.
References
- Rothman KJ, Lash TL, VanderWeele TJ, Haneuse S. Modern epidemiology. 4th ed. Philadelphia: Wolters Kluwer; 2021.
- National Academies of Sciences, Engineering, and Medicine. Reproducibility and replicability in science. Washington, DC: National Academies Press; 2019. https://doi.org/10.17226/25303
- Wasserstein RL, Lazar NA. The ASA statement on p-values: context, process, and purpose. Am Stat. 2016;70(2):129-133. https://doi.org/10.1080/00031305.2016.1154108
- Brown AW, Kaiser KA, Allison DB. Issues with data and analyses: errors, underlying themes, and potential solutions. Proc Natl Acad Sci U S A. 2018;115(11):2563-2570. https://doi.org/10.1073/pnas.1708279115
- von Elm E, Altman DG, Egger M, Pocock SJ, Gøtzsche PC, Vandenbroucke JP. The Strengthening the Reporting of Observational Studies in Epidemiology (STROBE) statement. Lancet. 2007;370(9596):1453-1457. https://doi.org/10.1016/S0140-6736(07)61602-X
These materials support learning and research planning. They require adaptation to the study context and do not replace methodological, statistical, ethical, or regulatory consultation.