
Part 12 · Module 6
Sampling and Integration in Mixed-Methods Studies
Plan linked qualitative and quantitative samples and use explicit integration strategies to generate defensible mixed-methods meta-inferences.
Learning outcomes
After completing this lecture, you should be able to:
- Distinguish probability and purposive sampling purposes within one mixed-methods study.
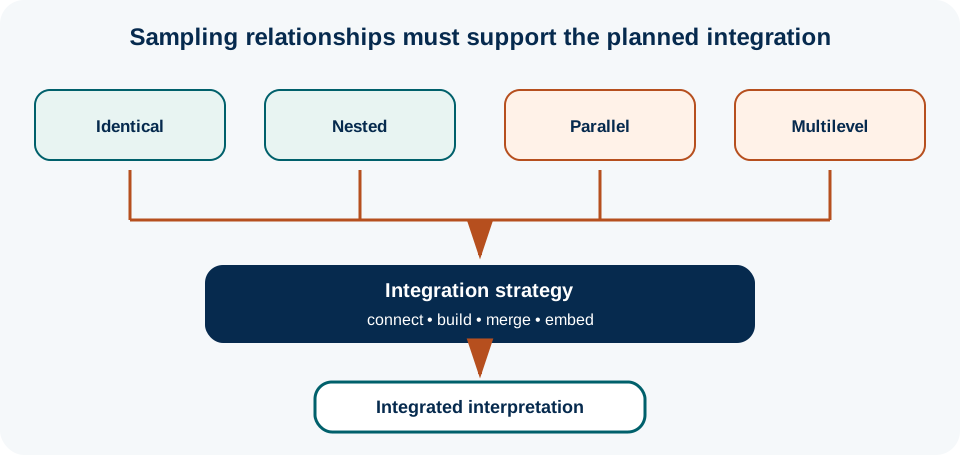
- Select appropriate identical, nested, parallel or multilevel sample relationships.
- Apply connecting, building, merging and embedding as method-level integration strategies.
- Construct joint displays and other integration structures that support meta-inference.
- Appraise sample mismatch, unequal quality and discordant findings without forcing artificial agreement.
Overview
Mixed-methods studies contain at least two sampling problems and one additional integration problem. The quantitative component may need a sample that supports estimation, comparison or modelling. The qualitative component may need purposive selection of information-rich cases. The mixed-methods design must then determine how those samples relate and how findings generated from different units, scales and forms of evidence will be brought together.[1,2]
A common misconception is that one overall sample-size calculation can justify the entire mixed-methods study. It cannot. Each component requires a sample rationale appropriate to its objective, and the relationship between components must support the intended integration.[2,3]
Integration is equally important. Researchers may integrate by connecting samples, building one phase from another, merging findings, or embedding one dataset within a larger design.[4] At interpretation, joint displays, matrices, weaving and case-based comparisons can help transform separate findings into meta-inferences—conclusions that arise from the combined evidence rather than from either strand alone.[5,6]
Why this matters
A mixed-methods study can have an excellent survey and excellent interviews yet still fail methodologically if the two components cannot speak to each other. Suppose a national survey measures access to postpartum testing among all eligible women, while interviews include only women attending a specialist hospital. The studies may both be rigorous, but direct integration about the experience of the national survey population may be weak because their sampling frames differ.
Similarly, a quantitative analysis might operate at patient level while qualitative interviews focus on clinic managers. Integration is possible, but it must occur at service or organisational level rather than pretending that manager narratives explain individual patient behaviour directly.
Planning sample relationships and integration before data collection therefore protects against integration failure—a problem that cannot always be repaired at the manuscript-writing stage.
Key concepts
Component sampling and mixed-methods sampling are related but different
Quantitative sampling often seeks statistical properties such as representativeness, precision or power. Qualitative sampling seeks information richness, variation and conceptual adequacy. Mixed-methods sampling adds another question: what relationship between these samples best supports the integration purpose?[1,2]
Teddlie and Yu described mixed-methods sampling as combining probability and purposive strategies in ways that follow the research design.[1] Palinkas and colleagues similarly emphasise purposeful sampling choices in mixed-method implementation research.[3]
Four useful sample relationships
Identical samples
The same participants contribute both qualitative and quantitative data.
Advantages: direct case-level linkage, strong within-person comparison and simpler integration.
Limitations: respondent burden, potential mode effects, and a sample that may be unnecessarily large for qualitative inquiry or too small for quantitative aims.
Nested samples
One component uses a subsample of the other, commonly a purposive qualitative subsample from a larger quantitative sample.
Advantages: preserves case-level linkage while allowing purposive qualitative selection.
Limitations: recontact bias and dependence on the larger component’s recruitment frame.
Parallel samples
The strands recruit separately from the same or related source populations.
Advantages: each component can optimise its own sampling strategy.
Limitations: individual-level convergence cannot be claimed without linkage; population mismatch must be assessed.
Multilevel samples
Different strands examine different levels, such as patients quantitatively and staff or organisations qualitatively.
Advantages: suited to health systems, implementation and cluster designs.
Limitations: requires careful specification of the level at which integrated inference is made.
When to use each sampling relationship
Choose the sample relationship from the integration question
Use an identical sample when the main mixed-methods question requires within-person comparison.
Use a nested sample when qualitative cases should be selected using quantitative profiles, outcomes or trajectories.
Use parallel samples when the same broad phenomenon is examined from complementary perspectives but direct participant linkage is unnecessary.
Use a multilevel structure when different actors or organisational levels contribute distinct evidence to a systems-level question.
Do not choose a sample relationship only because it is administratively easiest.
Sampling ratios and sample size
There is no universal ratio between qualitative and quantitative samples. A study may contain 1,000 survey participants and 25 interviews, or 80 trial participants and repeated qualitative interviews with 20 participants. The ratio should follow the component aims.
For the quantitative strand, sample-size planning may depend on precision, power, model development, event numbers or other statistical requirements. For qualitative research, adequacy depends on the study aim, specificity of the sample, quality of dialogue and analytic strategy rather than a universal numerical threshold.
The mixed-methods question adds a coverage requirement. If integration requires comparison across four quantitative profiles, the qualitative sample should include enough information-rich participants from each relevant profile to support that comparison. This is not a statistical power calculation; it is a design requirement for integration.
Document the complete mixed-methods sampling plan
- Define the sampling objective for each component.
- State the sampling frame and recruitment route for each component.
- Justify the sample size or adequacy criterion separately for each strand.
- Define whether samples are identical, nested, parallel or multilevel.
- State whether case-level linkage is required.
- Pre-specify purposive dimensions for qualitative subsampling where appropriate.
- Plan how refusals, attrition and missing linkage will affect integration.
- Identify the level at which meta-inferences will be made.
Integration at the methods level
Fetters and colleagues describe four important integration mechanisms.[4]
Connecting
One dataset determines sampling for another. Explanatory sequential studies often connect quantitative results to qualitative case selection.
Example: interview women from high- and low-access-burden quartiles and include both completers and non-completers.
Building
Findings from one component shape the data-collection procedures or instrument of the next.
Example: interview themes are translated into questionnaire domains and items.
Merging
Two datasets or sets of findings are brought together for comparison.
Example: survey estimates of referral clarity are compared with interview accounts of what women understood at discharge.
Embedding
One form of data is nested within a larger study design.
Example: process interviews are embedded within a cluster-randomised trial.
The mechanisms can coexist. A sequential study may connect samples and build an interview guide, then merge findings during interpretation.
Integration during analysis and interpretation
O’Cathain and colleagues describe approaches such as triangulation protocols, following a thread and mixed-methods matrices for integrating data.[6] Joint displays are especially useful because they place related quantitative and qualitative evidence into a common analytic structure.[5]
Narrative weaving
Results are organised by concept rather than by method. A section on “referral clarity” presents quantitative estimates, qualitative themes and integrated interpretation together.
Joint displays
A joint display can be a table, matrix, figure or case-by-variable display. Its purpose is not decoration but analytic comparison.[5]
Case-based integration
When samples are identical or nested, researchers can compare an individual’s quantitative profile with qualitative data. This can reveal typologies, discordant cases or mechanisms that disappear in aggregate results.
Data transformation
In some designs, qualitative data are transformed into categories or counts, or quantitative profiles are used to structure qualitative comparisons. Transformation must preserve the original methodological meaning and should not be performed merely to make all evidence numerical.
Meta-inference and inference transferMMed extension
A meta-inference is a conclusion developed from integrated evidence. Its strength depends on the quality of each component, the fit between components and the transparency of integration. Generalisation or transfer of a meta-inference should therefore consider both quantitative population inference and qualitative contextual transferability; the more these scopes diverge, the more cautious the integrated claim should be.
Building a joint display
A useful joint display contains more than two result columns. It often includes an explicit integration column.
Integrating access-burden survey data with interviews
The team has quantitative survey data and purposively selected interviews from women with different testing outcomes.
| Domain | Quantitative finding | Qualitative finding | Relationship | Meta-inference |
|---|---|---|---|---|
| referral clarity | lower clarity scores among non-completers | women describe uncertainty about location and responsibility | convergence | actionable referral information appears central to continuity |
| travel | distance predicts non-completion weakly | childcare and transport dependence matter more than kilometres alone | expansion | geographical distance is an incomplete proxy for access burden |
| risk knowledge | high scores in both groups | knowledgeable women still defer testing when competing demands are high | divergence | knowledge alone is insufficient when practical constraints dominate |
| local testing | associated with higher completion | participants describe convenience but variable laboratory availability | complementarity | local access may help only when operational capacity is reliable |
The findings are illustrative. The final column is the key mixed-methods product: it states what is learned from integrating the evidence.
A joint display should preserve uncertainty
Quantitative results should retain effect estimates and confidence intervals when relevant. Qualitative findings should retain their analytic context rather than being reduced to isolated quotations. The display should not convert one method into a token annotation of the other.
Discordance and dissonance
Mixed-methods researchers should expect some disagreement. Discordance can arise because:
- strands measure different constructs despite similar labels;
- samples differ;
- data were collected at different times;
- participants report beliefs that differ from observed behaviour;
- quantitative measurement is insensitive to context;
- qualitative sampling captures atypical but important cases; or
- the phenomenon genuinely varies across people or settings.
A structured discordance analysis can ask:
- Are the constructs actually comparable?
- Are the populations and time periods aligned?
- Is one component at higher risk of bias or measurement error?
- Does the contradiction disappear within relevant subgroups?
- Does the contradiction suggest a new mechanism or hypothesis?
- Should the final meta-inference remain uncertain or conditional?
Integration across levels and time
Complex health studies often integrate evidence collected at different levels. Patient-level outcomes may be combined with staff interviews, clinic-level implementation measures and district-level policy information. This can be scientifically valuable, but the integration logic must state how one level informs another. A clinic manager’s account can explain organisational processes that shape patient experience, but it does not directly reveal what every patient believed or did. Likewise, an individual interview cannot establish that a clinic-wide workflow caused a change in service performance.
One practical strategy is to create a multilevel integration matrix before analysis. Rows can represent clinics and columns can contain quantitative service indicators, aggregated patient measures, staff themes and contextual observations. Researchers can then compare patterns across cases while preserving the level of each datum. When the number of sites is small, these comparisons are primarily analytic and explanatory rather than statistical tests of site-level effects.
Time creates another integration challenge. A baseline survey, interviews conducted six months later and service outcomes measured after a policy change may all refer to different conditions. Researchers should record the temporal window represented by each component and ask whether integrated findings are contemporaneous enough to support the intended inference. In longitudinal mixed-methods research, repeated qualitative interviews can sometimes explain trajectories more convincingly than a single retrospective interview, but they also increase burden and analytic complexity.
Missing data and missing linkage
Mixed-methods integration can create a new form of missingness: missing cross-component linkage. A participant may have complete survey data but decline an interview, or an interview may be available while clinical outcome linkage fails. If case-level integration is restricted to participants with complete data in all components, the integrated subset may become systematically different from the original sample.
The protocol should therefore distinguish missingness within each component from missingness at the integration stage. Report how many participants were eligible for linkage, how many were linked successfully, and whether the linked subset differs materially on relevant observed characteristics. Qualitative non-participation should not be treated as a standard statistical missing-data problem, but its implications for which experiences are represented should still be considered.
Bias, validity and quality assurance
Mixed-methods quality is not achieved by “triangulating” two weak studies. Each component must be methodologically sound, and the integration must be appropriate.[4]
Key integration threats include:
- sample mismatch, when strands represent materially different populations without acknowledgement;
- unequal quality, when one strand is rigorous and the other superficial;
- integration by significance, when only statistically significant quantitative findings are discussed alongside qualitative data;
- qualitative tokenism, when quotations are used to illustrate numeric findings without independent analysis;
- loss of level, when clinic-level evidence is used to explain individual-level outcomes directly; and
- missing-linkage bias, when only participants with complete data across both strands are included in case-level integration.
Appraise the integration rather than only the components
- Is the mixed-methods purpose explicit?
- Does the sample relationship support the stated integration question?
- Are each strand’s methods appropriate independently?
- Is the point of integration identified?
- Is the integration procedure reproducible enough to understand what was compared?
- Are discordant findings investigated rather than suppressed?
- Does the meta-inference stay within the populations, levels and time periods represented by the data?
Ethical and governance considerations
Consent should also state whether data from different study components will be linked. Access to the crosswalk connecting participant identifiers across datasets should be restricted and separated from analytic data where practical.
Interface with statistical analysis
Mixed methods does not change the statistical requirements of the quantitative component. Clustered, repeated, survey-weighted or longitudinal data still require appropriate analysis. Integration should carry forward the substantive estimate and its uncertainty, not just whether p < 0.05.
When quantitative profiles are used for purposive qualitative sampling, cut-points should have a substantive rationale. Arbitrary dichotomisation can discard information and create artificial groups. Sometimes it is better to sample along a continuum or use multiple characteristics rather than one binary threshold.
Quantitising qualitative data—turning codes into counts—can be useful for specific questions but does not automatically make those counts statistically representative. Their denominator is the qualitative sample, which was usually not selected for population estimation.
Suggested protocol or reporting wording
Common mistakes
Knowledge check
A study wants to interview participants with unusually high and low symptom-change scores after a trial. Which sample relationship is most appropriate?
Answer and reasoning
A nested relationship is appropriate: the qualitative participants are purposively selected from the larger quantitative trial sample using phase-one quantitative profiles. This supports case-level linkage and explanatory integration.
Why can a parallel-sample study still be mixed methods?
Answer and reasoning
Direct participant linkage is not required for all mixed-methods questions. Parallel samples can support conceptual, service-level or population-level integration when the source populations and levels of inference are appropriate and clearly described.
What is the difference between merging and connecting?
Answer and reasoning
Connecting uses one component to determine sampling for another. Merging brings two datasets or sets of findings together for comparison or synthesis. A study can use both mechanisms.
What should researchers do when qualitative and quantitative findings conflict?
Answer and reasoning
First examine construct alignment, sampling, timing, measurement quality and subgroup differences. If a defensible explanation is not available, retain the discordance and express the meta-inference conditionally rather than forcing agreement.
Why should effect estimates and confidence intervals appear in integrated displays when relevant?
Answer and reasoning
Because integration should preserve the magnitude and uncertainty of quantitative evidence. Reducing results to significant/non-significant labels discards information and can distort the mixed-methods interpretation.
Key take-home messages
Key take-home messages
- Justify qualitative and quantitative samples separately, then justify how the samples relate.
- Identical, nested, parallel and multilevel sample relationships support different integration questions.
- Connecting, building, merging and embedding are distinct but compatible integration mechanisms.
- Joint displays should generate integrated interpretation, not merely place two results side by side.
- Discordance can be scientifically informative and should not be forced into convergence.
- Meta-inferences must respect the quality, populations, levels, timing and uncertainty of the component evidence.
References
- Teddlie C, Yu F. Mixed methods sampling: a typology with examples. J Mix Methods Res. 2007;1(1):77–100. https://doi.org/10.1177/1558689806292430
- Collins KMT, Onwuegbuzie AJ, Jiao QG. A mixed methods investigation of mixed methods sampling designs in social and health science research. J Mix Methods Res. 2007;1(3):267–294. https://doi.org/10.1177/1558689807299526
- Palinkas LA, Horwitz SM, Green CA, Wisdom JP, Duan N, Hoagwood K. Purposeful sampling for qualitative data collection and analysis in mixed method implementation research. Adm Policy Ment Health. 2015;42(5):533–544. https://doi.org/10.1007/s10488-013-0528-y
- Fetters MD, Curry LA, Creswell JW. Achieving integration in mixed methods designs—principles and practices. Health Serv Res. 2013;48(6 Pt 2):2134–2156. https://doi.org/10.1111/1475-6773.12117
- Guetterman TC, Fetters MD, Creswell JW. Integrating quantitative and qualitative results in health science mixed methods research through joint displays. Ann Fam Med. 2015;13(6):554–561. https://doi.org/10.1370/afm.1865
- O’Cathain A, Murphy E, Nicholl J. Three techniques for integrating data in mixed methods studies. BMJ. 2010;341:c4587. https://doi.org/10.1136/bmj.c4587
These materials support learning and research planning. They require adaptation to the study context and do not replace methodological, statistical, ethical, or regulatory consultation.