
Part 14 · Module 8
Sensitivity Analyses and Robustness Checks
Design sensitivity analyses that stress-test important assumptions, distinguish robustness from multiplicity, and communicate how conclusions change under credible alternatives.
Learning outcomes
After completing this lecture, you should be able to:
- Distinguish a sensitivity analysis from exploratory reanalysis and researcher degrees of freedom.
- Link each robustness check to a specific assumption or source of potential bias.
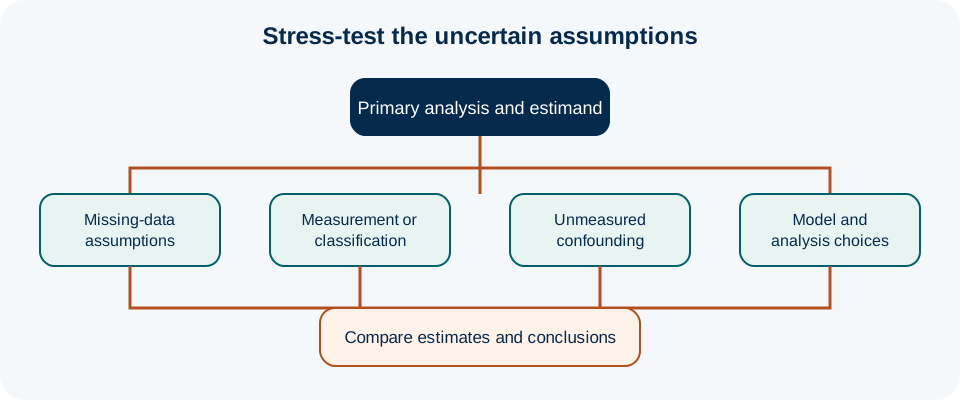
- Plan sensitivity analyses for missing data, unmeasured confounding, measurement error and model specification.
- Interpret E-values, tipping points and quantitative bias analyses within their assumptions and limitations.
- Report robustness without cherry-picking the analysis that gives the preferred result.
Overview
Sensitivity analysis asks whether a substantive conclusion depends on assumptions that are uncertain but scientifically plausible. A strong sensitivity analysis changes one identified assumption or data feature for a reason and examines how the target estimate or decision changes. It is not a licence to rerun many models until one produces a preferred p-value.[1]
Robustness is multidimensional. An estimate can be stable to alternative model forms yet highly sensitive to unmeasured confounding. It can be robust to missing-data assumptions but dependent on one influential site. The analysis plan should therefore map sensitivity analyses to the study’s most important threats rather than use a generic checklist.
Why this matters
Every study relies on assumptions that are partly unverifiable: missingness mechanisms, measurement accuracy, confounder completeness, functional form, proportional hazards, correlation structure, intervention adherence or transportability. Hiding these assumptions behind one primary model creates false certainty.
Regulatory guidance for trials treats sensitivity analysis as a way to examine robustness of the primary inference to deviations from assumptions, particularly around estimands and missing data.[1] Observational research extends the same logic to unmeasured confounding and measurement bias.[2,3]
Key concepts
A primary analysis should answer the prespecified research question under the main set of assumptions. A sensitivity analysis evaluates the same or closely related estimand under alternative plausible assumptions. An exploratory analysis asks a new question or searches for patterns. Keeping these roles distinct prevents sensitivity analyses from becoming undisclosed multiplicity.
The strongest sensitivity analyses are assumption-targeted. They state the uncertain assumption, the alternative values or models, why those alternatives are plausible and what change in conclusion would matter.
Prespecify the robustness map
During protocol or statistical-analysis planning, list the assumptions most likely to threaten the primary conclusion. Rank them by plausibility and consequence. Common domains include missing outcomes, unmeasured confounding, exposure misclassification, alternative outcome definitions, clustering, functional form and influential observations.
Not every conceivable analysis deserves equal status. Focus on assumptions for which there is genuine uncertainty and a plausible mechanism linking them to bias.
Missing-data sensitivity analyses
If the primary analysis assumes MAR, sensitivity analysis can use delta adjustments, pattern-mixture models, selection models or tipping-point scenarios to examine MNAR departures. The parameter should be interpretable in clinical terms—for example, unobserved participants being 10, 20 or 30 percentage points less likely to complete testing than predicted under MAR.
A complete-case analysis is not automatically a useful sensitivity analysis if it relies on a different and implausible assumption.
Unmeasured confounding
Quantitative bias analysis can specify prevalence and strength of an unmeasured confounder and recalculate adjusted associations. The E-value summarises the minimum strength of association, on the risk-ratio scale under its framework, that an unmeasured confounder would need with both exposure and outcome to explain away an observed association.[2]
The E-value does not prove absence of confounding, does not incorporate all biases, and can be misleading if interpreted without knowledge of plausible confounders. It is one sensitivity metric, not a quality score.
Measurement-error sensitivity
For a binary exposure or outcome, vary plausible sensitivity and specificity values using deterministic or probabilistic bias analysis. For continuous measures, vary reliability or calibration parameters when external information exists. Parameter ranges should come from validation studies, literature or defensible expert knowledge rather than arbitrary convenient values.[3]
Alternative operational definitions
Studies often depend on thresholds: what counts as adherence, a positive diagnostic test, severe burden or treatment completion. If several definitions are scientifically credible, prespecify alternatives and show whether conclusions materially change. Do not define alternatives after seeing which threshold produces significance.
When the construct itself changes under an alternative definition, the analysis may estimate a different scientific quantity; label this clearly rather than calling every alternative a sensitivity analysis.
Model specification
Assess reasonable functional forms for continuous covariates, correlation structures for repeated measures, proportional-hazards assumptions, link functions or distributional choices when these could affect the target estimate. Flexible modelling can reduce functional-form bias but also increase researcher degrees of freedom. Prespecification, diagnostics and transparent comparison are important.
Influential observations and sites
Removing outliers solely because they weaken an effect is unacceptable. Influence analyses should be based on prespecified or diagnostic criteria and distinguish data errors from valid extreme observations. In multicentre studies, leave-one-site-out analyses can reveal whether the conclusion depends on one atypical centre, but such results should be interpreted in light of site size and case mix.
Negative controls and falsification checks
A negative-control outcome or exposure can help detect certain confounding or measurement structures when a causal effect is not expected but the same bias pathway could operate. Falsification endpoints require careful justification: an unexpected association may indicate bias, but a null result does not prove exchangeability. These approaches complement, rather than replace, a causal model.
Multiverse and specification-curve ideas
When many analytical choices are genuinely defensible, a multiverse or specification-curve analysis can show the distribution of results across a prespecified set of reasonable decisions. The goal is transparency about analytical dependence, not voting by majority across models. Correlated specifications and invalid models should not be treated as independent confirmations.
Interpretation: stability is not truth
If the primary result remains similar across plausible analyses, confidence in robustness increases with respect to those tested assumptions. It does not demonstrate freedom from untested biases. If results vary substantially, do not choose the favourite model; identify which assumption drives the difference and report that uncertainty as a scientific finding.
Sensitivity versus subgroup analysis
Subgroup analysis asks whether an effect differs across participant groups; sensitivity analysis asks whether the inference changes under alternative assumptions. The two can overlap but should not be conflated. Repeating analyses in many subgroups is not a robustness check and introduces multiplicity and instability.
Decision-focused robustness
In clinical or policy research, a useful sensitivity analysis can ask whether the decision changes rather than whether p remains below 0.05. For example, does the confidence interval cross a clinically important margin? Does net benefit remain positive across reasonable threshold probabilities? Does a cost-effectiveness conclusion change under plausible parameter values? This keeps robustness linked to the actual decision.
Design a defensible sensitivity analysis
- State the primary estimand and primary analysis first.
- Name one uncertain assumption or bias mechanism.
- Select alternative values or models that are scientifically plausible.
- Prespecify how the estimate or decision will be compared.
- Explain which conclusion would count as materially changed.
- Report all planned sensitivity analyses, not only those that support the preferred result.
Robustness map for a postpartum study
illustrativeTable 1. Assumption-targeted sensitivity plan
| Threat | Primary assumption | Sensitivity analysis | Interpretation target |
|---|---|---|---|
| Missing outcome | MAR conditional on measured predictors | Delta/tipping-point scenarios | How adverse must unobserved outcomes be to alter conclusion? |
| Unmeasured motivation | Measured covariates sufficient | E-value / quantitative confounding scenarios | Strength of confounding required |
| Exposure misclassification | Access-burden category accurate | Vary sensitivity/specificity | Corrected effect range |
| Site influence | Common adjusted association | Leave-one-site-out estimates | Dependence on one centre |
| Threshold choice | Primary validated cut-off | Prespecified alternative cut-offs | Whether substantive inference changes |
Questions for evaluating robustness claims
- What specific assumption does each sensitivity analysis test?
- Were alternative parameter values scientifically justified?
- Does the analysis target the same estimand or a different scientific quantity?
- Were all planned sensitivity analyses reported?
- Are discordant results explained rather than dismissed?
Quantitative bias analysis and probabilistic uncertaintyMMed extension
Quantitative bias analysis can propagate uncertainty about bias parameters by specifying probability distributions for sensitivity, specificity, selection probabilities or confounding strength and repeatedly recalculating the corrected estimate.[3] This produces a distribution conditional on the bias model and chosen parameter distributions. It can be combined with conventional sampling uncertainty, but the resulting interval remains conditional on assumptions about the bias mechanism. Transparency about parameter sources is therefore essential.
For E-values, remember that the metric is calibrated to a particular confounding scenario and effect scale.[2] It should be compared with plausible measured confounder-outcome and confounder-exposure associations rather than interpreted in isolation.
Designing interpretable sensitivity parameters
A sensitivity analysis becomes more informative when its parameters have a clinical or operational meaning. For missing outcomes, a parameter might represent how many units worse an unobserved outcome is assumed to be than predicted under the primary model. Multiple-imputation strategies should be aligned with the substantive analysis and variables associated with missingness.[4] For unmeasured confounding, parameters can represent the strength of association that an omitted factor would need with both exposure and outcome. For measurement error, parameters may describe plausible sensitivity and specificity, calibration error, or systematic shifts in a continuous measure.[2,3]
Choosing these values should not be arbitrary. Investigators can use external validation studies, internal substudy data, prior cohorts, expert elicitation or clinically meaningful thresholds. A wide range may be appropriate when knowledge is poor, but the report should distinguish empirically supported values from deliberately extreme stress tests. The goal is to show readers which assumptions drive the conclusion.
A useful presentation is a tipping-point analysis: identify the departure from the primary assumption required to change a decision, confidence-interval interpretation or clinically meaningful conclusion. Tipping points do not prove that the assumption at that boundary is true; they make the fragility of the conclusion interpretable.
Triangulation is different from sensitivity analysis
Sensitivity analysis asks whether a result changes when assumptions or analytical choices within a study are changed. Modern epidemiologic reasoning treats such analyses as part of a broader assessment of how design and modelling assumptions affect inference.[5] Triangulation asks whether evidence generated through different designs, data sources or sources of bias points towards a compatible conclusion. For example, a treatment association may be examined in a routine-care cohort, a natural experiment and a randomised trial. Concordance across methods with different bias structures can strengthen interpretation, while discordance can reveal design-specific limitations.
The two ideas complement each other but should not be conflated. Re-running one dataset with five regression specifications is not triangulation. Conversely, having three studies that share the same unmeasured confounding mechanism may provide less independent support than their number suggests. A robustness argument should describe both within-study sensitivity and, where available, cross-design evidence.
Robustness of the estimand versus robustness of the estimator
Analysts often change models without noticing that they have also changed the scientific question. A complete-case analysis, a treatment-policy estimand, a hypothetical no-rescue-medication estimand and a per-protocol effect may all produce different numbers because they target different quantities, not because one estimator is more robust.[1]
Before comparing analyses, label the estimand each analysis targets. Sensitivity analyses should generally alter assumptions while keeping the target estimand fixed. Supplementary analyses may legitimately target a different estimand, but they answer a different question and should be reported as such. This distinction prevents apparent “robustness” that is created by silently moving the target.
The same principle applies in observational research. Changing an exposure definition from “current use” to “ever use” or changing follow-up from 30 days to 1 year may change the causal contrast itself. These can be valuable supplementary analyses, but the interpretation should explain whether the robustness check changes only the analytical implementation or the underlying research question.
Specification uncertainty and researcher degrees of freedom
Some studies admit many defensible analytical choices: covariate parameterisation, transformation, exposure windows, outcome thresholds, interaction terms, inclusion rules and model families. Selecting one specification after seeing results can create optimism even when every individual choice seems reasonable. Prespecification reduces this risk, but it cannot anticipate every data issue.
A structured approach distinguishes core choices required by the protocol from uncertain choices that remain genuinely debatable. For the latter, a multiverse or specification-curve analysis can show the distribution of estimates across a pre-defined set of defensible specifications. Such displays are exploratory unless the decision set was specified prospectively, and they should not be reduced to counting how many p-values cross 0.05.
The important questions are whether effect direction, magnitude and uncertainty remain materially similar; which choices produce the largest changes; and whether those choices correspond to different causal assumptions. A forest or specification plot can reveal that a result described as “robust” is actually dependent on one exposure definition or one influential site.
Sensitivity analysis as part of design rather than rescue
Robustness planning should begin before data collection because many useful sensitivity analyses require information that cannot be reconstructed later. Quantitative bias analysis for exposure misclassification needs plausible validation parameters. Missing-not-at-random analyses benefit from recorded reasons for missingness and auxiliary variables. Assessing contamination requires process measures. Evaluating site influence requires site identifiers and consistent outcome definitions.
The protocol should therefore include a small assumption register: principal assumption, why it matters, information needed to assess it, planned primary analysis, and planned sensitivity analysis if the assumption is uncertain. This connects bias prevention to analysis and prevents the familiar end-of-study problem of recognising an important threat but lacking the variables needed to examine it.
Sensitivity analyses also require governance. Teams should document which analyses were prespecified, which were triggered by observed data quality, and which were requested during peer review. This chronology helps readers distinguish planned robustness assessment from post hoc searching for a favourable result.
Interface with statistical analysis
Sensitivity analyses can be implemented through alternative models, bias parameters, reweighting, multiple imputation, bootstrap procedures or causal estimators. The statistical mechanics belong in the relevant Biostatistics lecture. Methodologically, each analysis should be linked to an assumption, preserve the estimand where intended and be interpreted in terms of effect estimates and decisions rather than p-value switching.
Worked example
Building a robustness portfolio for access burden and postpartum testing
The adjusted primary association is a risk ratio of 0.72 for test completion among women with high versus low access burden. The team identifies four major uncertainties before unblinding outcome summaries: incomplete outcomes, imperfect burden classification, possible unmeasured health motivation and site heterogeneity.
For missing outcomes, a tipping-point analysis progressively lowers predicted completion among unobserved high-burden women. The result remains below 0.85 until an implausibly large departure from the MAR model. For unmeasured confounding, an E-value is calculated and compared with the observed associations of strong measured socioeconomic confounders. For exposure misclassification, a probabilistic bias analysis uses validation ranges from the pilot study. Leave-one-site-out estimates identify one rural site with a weaker association but do not reverse the direction.
One alternative threshold for high burden gives a risk ratio of 0.80 rather than 0.72. Instead of calling the primary result “robust” without qualification, the report states that the direction persists across planned checks but magnitude is sensitive to the operational threshold. That is a more informative conclusion.
Suggested protocol or reporting wording
Common mistakes
Knowledge check
What distinguishes a sensitivity analysis from an exploratory analysis?
Answer and reasoning
A sensitivity analysis stress-tests a specified assumption relevant to the primary inference, ideally while retaining the same estimand. Exploratory analysis asks additional questions or searches for patterns.
Does a large E-value prove causality?
Answer and reasoning
No. It quantifies one unmeasured-confounding scenario on a particular scale. It does not address selection bias, measurement error, multiple confounders with complex structure or other causal assumptions.
Why can complete-case analysis be a poor “sensitivity analysis” for multiple imputation?
Answer and reasoning
It may rely on a different and less plausible missingness mechanism and can change the analysed population. A useful sensitivity analysis should deliberately test a plausible departure from the primary assumption.
What should investigators do if one plausible sensitivity analysis reverses the conclusion?
Answer and reasoning
Report it and identify the assumption responsible. The instability is important evidence about uncertainty; choosing the analysis that agrees with the preferred result would be misleading.
Why should robustness be judged on effect magnitude as well as p-values?
Answer and reasoning
A result can remain statistically significant while changing enough to alter clinical meaning, or lose significance while retaining a clinically similar estimate because precision changed. The scientific conclusion is not a threshold test.
Key take-home messages
Key take-home messages
- Sensitivity analysis should be assumption-targeted, prespecified where possible and interpreted transparently.
- Robustness to one assumption does not imply robustness to all forms of bias.
- E-values, tipping points and quantitative bias analyses are tools, not certificates of validity.
- Alternative analyses should be judged by effect magnitude, uncertainty and decision relevance—not only p-values.
- Discordant sensitivity results are informative and should be reported, not hidden.
References
- International Council for Harmonisation of Technical Requirements for Pharmaceuticals for Human Use. ICH E9(R1): Addendum on estimands and sensitivity analysis in clinical trials. Geneva: ICH; 2019. https://database.ich.org/sites/default/files/E9-R1_Step4_Guideline_2019_1203.pdf
- VanderWeele TJ, Ding P. Sensitivity analysis in observational research: introducing the E-value. Ann Intern Med. 2017;167(4):268-274. https://doi.org/10.7326/M16-2607
- Lash TL, Fox MP, Fink AK. Applying quantitative bias analysis to epidemiologic data. New York: Springer; 2009. https://doi.org/10.1007/978-0-387-87959-8
- White IR, Royston P, Wood AM. Multiple imputation using chained equations: issues and guidance for practice. Stat Med. 2011;30(4):377-399. https://doi.org/10.1002/sim.4067
- Rothman KJ, Lash TL, VanderWeele TJ, Haneuse S. Modern epidemiology. 4th ed. Philadelphia: Wolters Kluwer; 2021.
These materials support learning and research planning. They require adaptation to the study context and do not replace methodological, statistical, ethical, or regulatory consultation.